

Trend
In the admin: a Dashboard › a widget › Edit
Trend widgets draw values over time or over ordered categories. Return the rows oldest first: the chart reads them in the query's order, and the last row is "now".
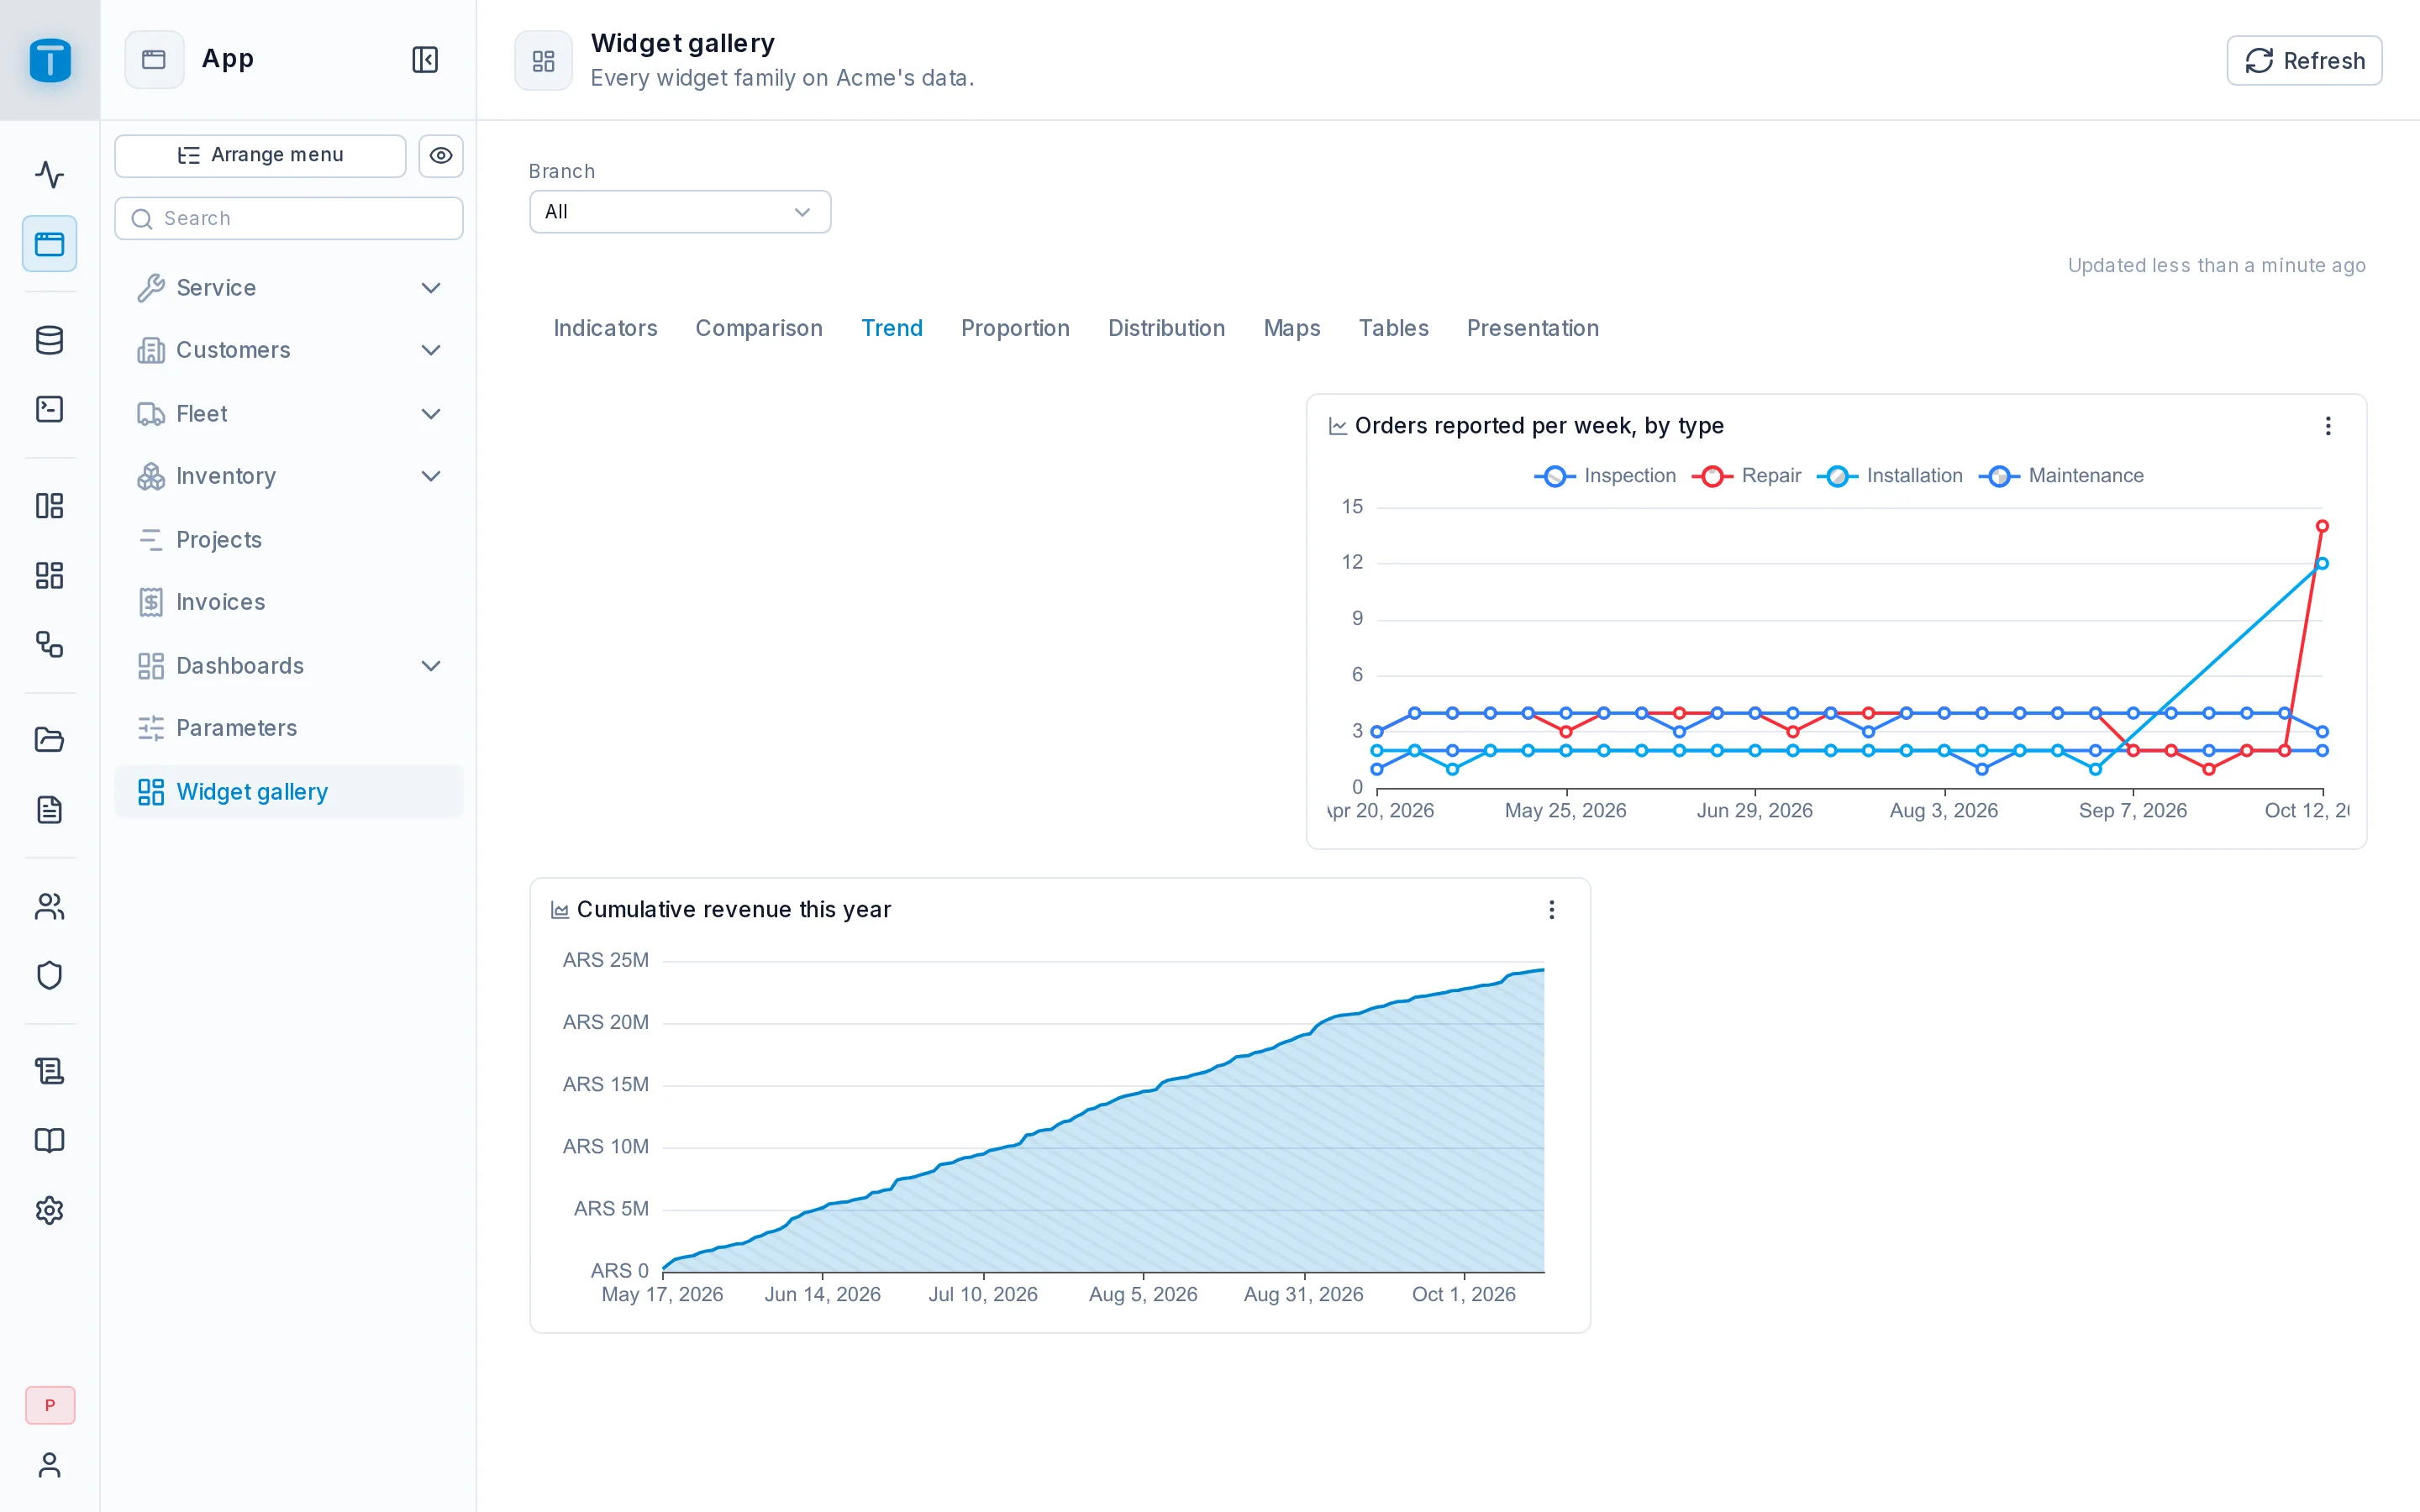
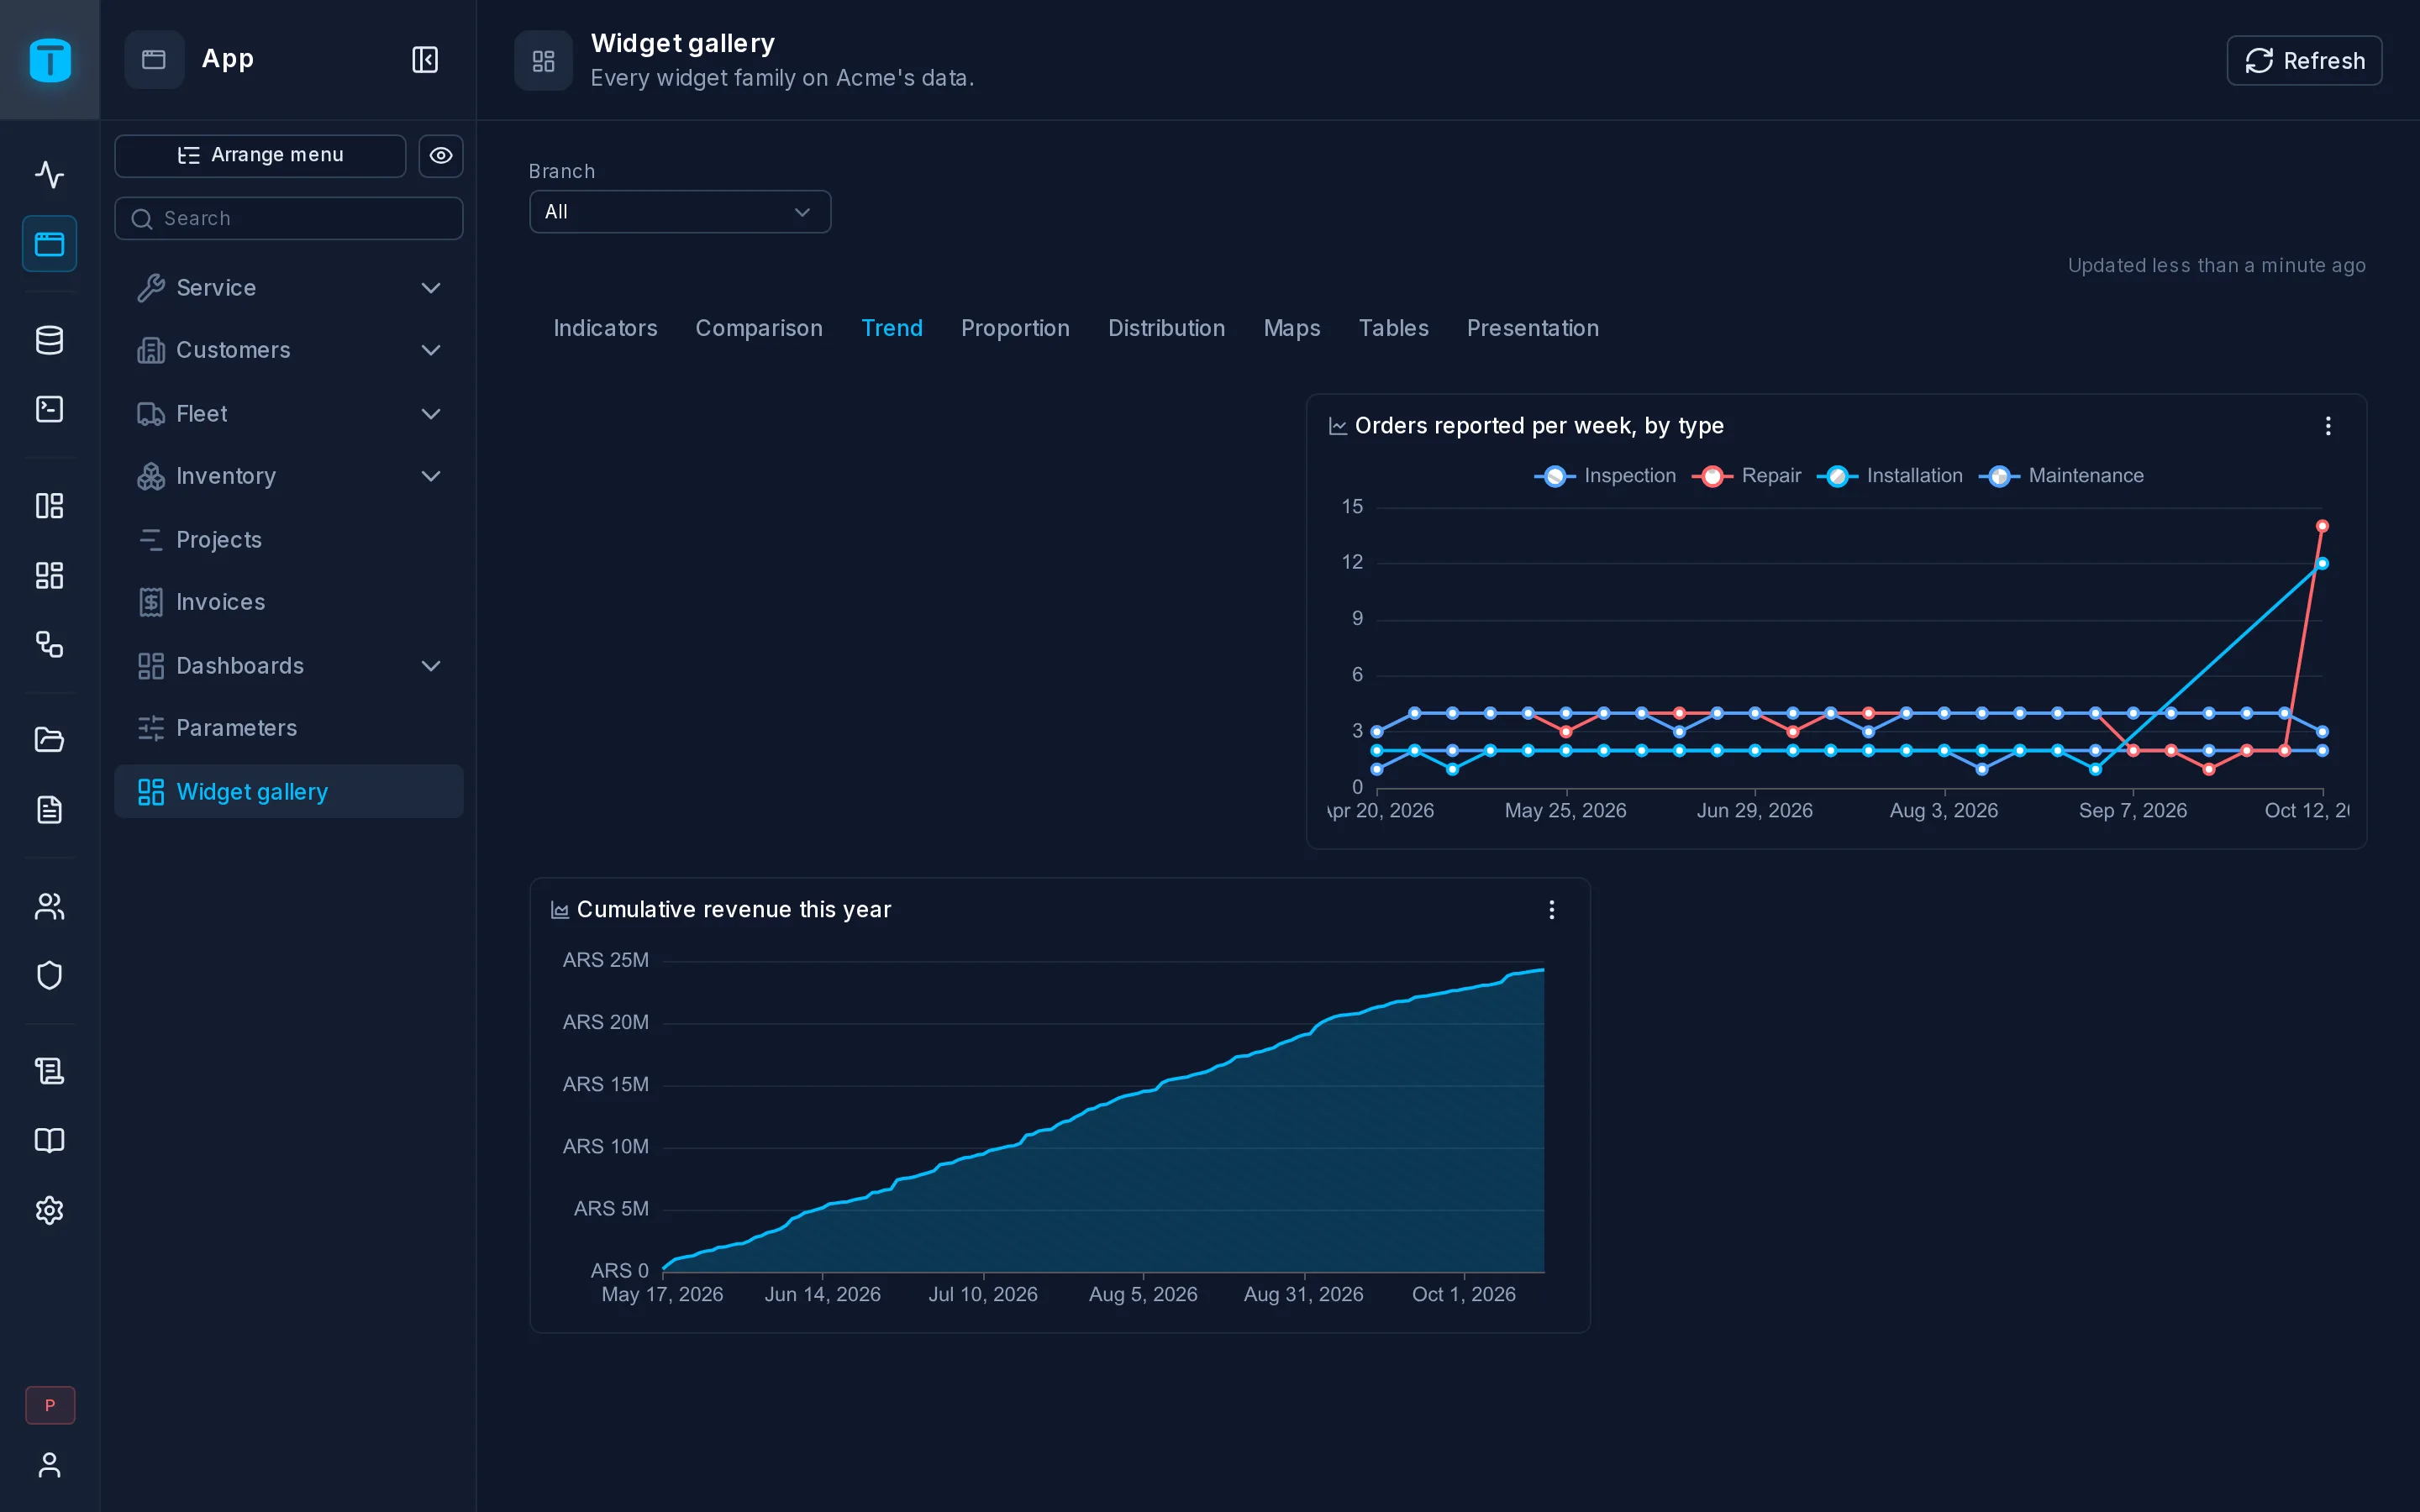
Line chart
One line per series.
| Role | Takes | Unset |
|---|---|---|
| Category | the axis: a date makes a time axis | the first column that isn't a number |
| Values | one line per column, in order | every number column |
| Series | long format: one line per value of this column, with one value column | none: choose it by hand |
Orders reported per week, a line per order type: choose type for Series.
SELECT date_trunc('week', reported_at)::date AS week, type, count(*) AS orders
FROM work_orders
WHERE ($VAR.period.from IS NULL OR reported_at >= $VAR.period.from)
  AND ($VAR.period.to IS NULL OR reported_at < $VAR.period.to)
GROUP BY 1, 2
ORDER BY 1
date_trunc cuts weeks in the viewer's time zone. Each type's line takes its label and color from the presentation of type in Database.
| Setting | |
|---|---|
| Smooth line | curves the line between points |
| Format, Compact number, Color | how values read; the accent color of a single line |
| Show legend | the lines' names. A single line hides it |
| Series | per line: its name, color, type (bar, line or area), axis (left or right) and format |
| Axes | each axis' title; the value axes' minimum, maximum, logarithmic scale and format. Unset minimum: fitted to the data |
| Reference lines | a line at a number, a statistic of a series, a column or a variable; a band between two values |
| On click | what a click on a point does |
| Zoom | a slider under the chart, the wheel or a pinch, to zoom into a range |
Previous period
A Date range variable also gives the period just before it: $VAR.period.prev_from and $VAR.period.prev_to. This month gives last month; Last 7 days the 7 days before. To compare both in one chart, return them as two value columns.
LINE
One line per series, over time or categories - oldest first.
Size: 6 × 4 of the 12-column grid, at least 3 × 3 · Also: series, thresholds, events, zoom, export
| Data | Code | Takes | Required | Unset | |
|---|---|---|---|---|---|
| Category | category | category, time | yes | first | The axis labels - a date makes a time axis. Defaults to the first column that isn't a number. |
| Values | values | number | yes | all | One series per column, in this order. Defaults to every number column. |
| Series | series | category | none | Long format: one series per value of this column (month, seller, total) - with one value column. Optional. |
| Property | Code | Section | Values | |
|---|---|---|---|---|
| Smooth line | smooth | appearance | default false | Curves the line between points. |
| Format | displayFormat | format | How its numbers read - a displayFormat pattern: "$ #,##0", "#,##0.00", "0.0 %" (% never multiplies: 85 reads 85.0 %), "0.0 h", "CURRENCY:ARS". Unset: the value column's own (its presentation), else the locale's. | |
| Compact number | compact | format | Abbreviates large numbers - 11.6M, 2.4K - keeping the format's text and decimals ("$ #,##0" + compact: $ 1.3M). Unset: on, unless a format applies (its own or its column's). | |
| Color | color | appearance | A palette hue for its marks - unset, the theme's primary. | |
| Show legend | showLegend | appearance | default true | The series' (or slices') names, beside the chart. |
| Series | series | series | Per value column - or, in long format, per value of the Series column: {label, color (a palette hue), type: bar|line|area, axis: left|right, displayFormat}. Unset: the column's title and format; in long format, the Series column's value labels and colors (its presentation). | |
| Axes | axes | axes | {category: {title}, value: {title, min, max, log, displayFormat}, value2: {...}} - value2 is the right axis, used by series with axis: right. Unset min: 0 for bars and areas, fitted to the data for lines. | |
| Reference lines | references | thresholds | Lines and bands on the value axis: {type: "line", value: a number | average | min | max | median | {column} | {variable}, label, color, series?} or {type: "band", from, to, label, color}. Labels read in the axis' format. | |
| On click | click | events | What a click on a mark does: {action: "FILTER", variable, value} sets a variable of this dashboard; {action: "DATAVIEW", dataview, filter} opens a DataView filtered (the where grammar); {action: "DASHBOARD", dashboard, variables, tab}; {action: "RECORD", dataview, pk}; {action: "URL", url, newTab, inEmbeds}. Values are formulas over (_ columns too) and ; targets by id. hint: the tooltip's last line. | |
| Zoom | zoom | zoomExport | default false | A bar under the chart, and the wheel or a pinch, to zoom into a range. |
SELECT m::date AS month, (100 + 20 * extract(month FROM m))::int AS revenue FROM generate_series(date '2026-01-01', date '2026-12-01', interval '1 month') AS m
Area chart
The same roles and settings as a line chart, with the area below each line filled, and Stacked to stack the series. Unset, its value axis starts at 0. Cumulative revenue this year:
SELECT date_trunc('month', i.issued_on)::date AS month,
       sum(sum(ii.quantity * ii.unit_price))
         OVER (ORDER BY date_trunc('month', i.issued_on)) AS cumulative
FROM invoices i
JOIN invoice_items ii ON ii.invoice = i.id
WHERE i.status <> 'DRAFT'
  AND i.issued_on >= date_trunc('year', current_date)
GROUP BY 1
ORDER BY 1
generate_series and LEFT JOIN the data to them.AREA
Lines filled below - totals over time.
Size: 6 × 4 of the 12-column grid, at least 3 × 3 · Also: series, thresholds, events, zoom, export
| Data | Code | Takes | Required | Unset | |
|---|---|---|---|---|---|
| Category | category | category, time | yes | first | The axis labels - a date makes a time axis. Defaults to the first column that isn't a number. |
| Values | values | number | yes | all | One series per column, in this order. Defaults to every number column. |
| Series | series | category | none | Long format: one series per value of this column (month, seller, total) - with one value column. Optional. |
| Property | Code | Section | Values | |
|---|---|---|---|---|
| Stacked | stacked | appearance | default false | Stacks the series instead of placing them side by side. |
| Smooth line | smooth | appearance | default false | Curves the line between points. |
| Format | displayFormat | format | How its numbers read - a displayFormat pattern: "$ #,##0", "#,##0.00", "0.0 %" (% never multiplies: 85 reads 85.0 %), "0.0 h", "CURRENCY:ARS". Unset: the value column's own (its presentation), else the locale's. | |
| Compact number | compact | format | Abbreviates large numbers - 11.6M, 2.4K - keeping the format's text and decimals ("$ #,##0" + compact: $ 1.3M). Unset: on, unless a format applies (its own or its column's). | |
| Color | color | appearance | A palette hue for its marks - unset, the theme's primary. | |
| Show legend | showLegend | appearance | default true | The series' (or slices') names, beside the chart. |
| Series | series | series | Per value column - or, in long format, per value of the Series column: {label, color (a palette hue), type: bar|line|area, axis: left|right, displayFormat}. Unset: the column's title and format; in long format, the Series column's value labels and colors (its presentation). | |
| Axes | axes | axes | {category: {title}, value: {title, min, max, log, displayFormat}, value2: {...}} - value2 is the right axis, used by series with axis: right. Unset min: 0 for bars and areas, fitted to the data for lines. | |
| Reference lines | references | thresholds | Lines and bands on the value axis: {type: "line", value: a number | average | min | max | median | {column} | {variable}, label, color, series?} or {type: "band", from, to, label, color}. Labels read in the axis' format. | |
| On click | click | events | What a click on a mark does: {action: "FILTER", variable, value} sets a variable of this dashboard; {action: "DATAVIEW", dataview, filter} opens a DataView filtered (the where grammar); {action: "DASHBOARD", dashboard, variables, tab}; {action: "RECORD", dataview, pk}; {action: "URL", url, newTab, inEmbeds}. Values are formulas over (_ columns too) and ; targets by id. hint: the tooltip's last line. | |
| Zoom | zoom | zoomExport | default false | A bar under the chart, and the wheel or a pinch, to zoom into a range. |
SELECT m::date AS month, sum(10 + extract(month FROM m)::int) OVER (ORDER BY m) AS cumulative FROM generate_series(date '2026-01-01', date '2026-12-01', interval '1 month') AS m
Next steps
- Proportion: parts of a whole.
- Variables: the period and its presets.