

Proportion
In the admin: a Dashboard › a widget › Edit
Proportion widgets show parts of a whole: each row a slice, a step or a rectangle. Funnel, Treemap and Sunburst refuse a negative value when they run, naming the row.
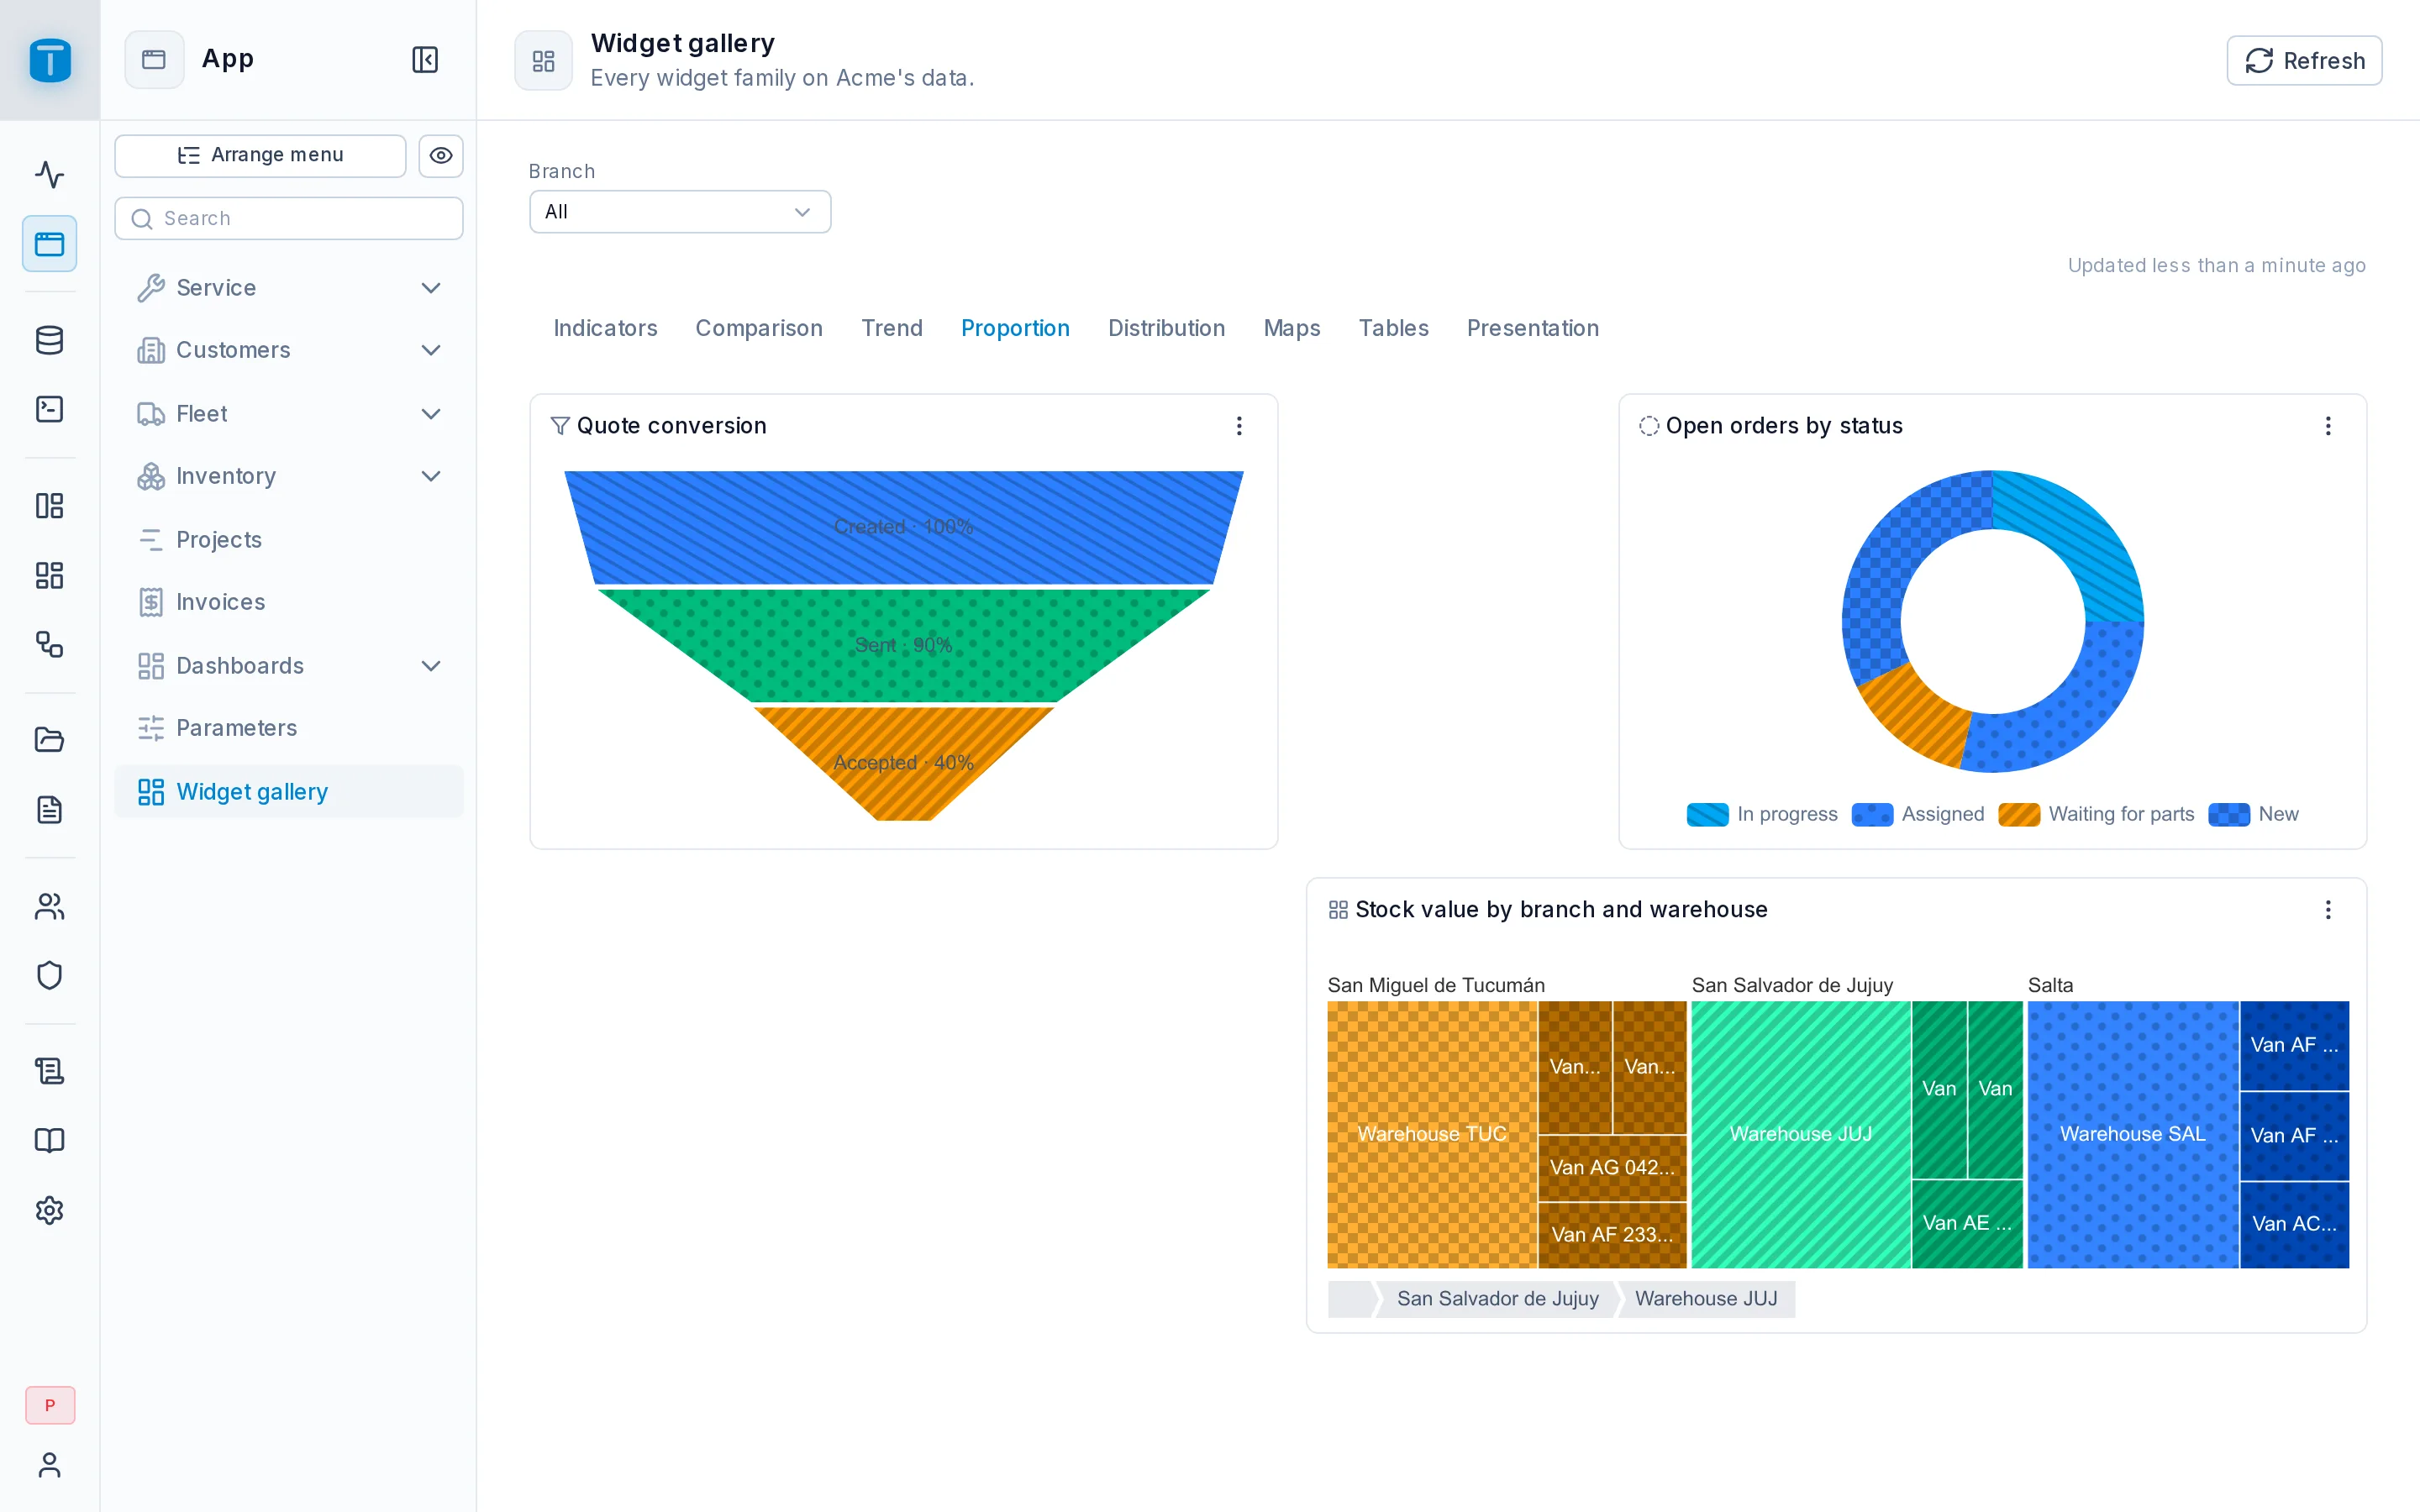
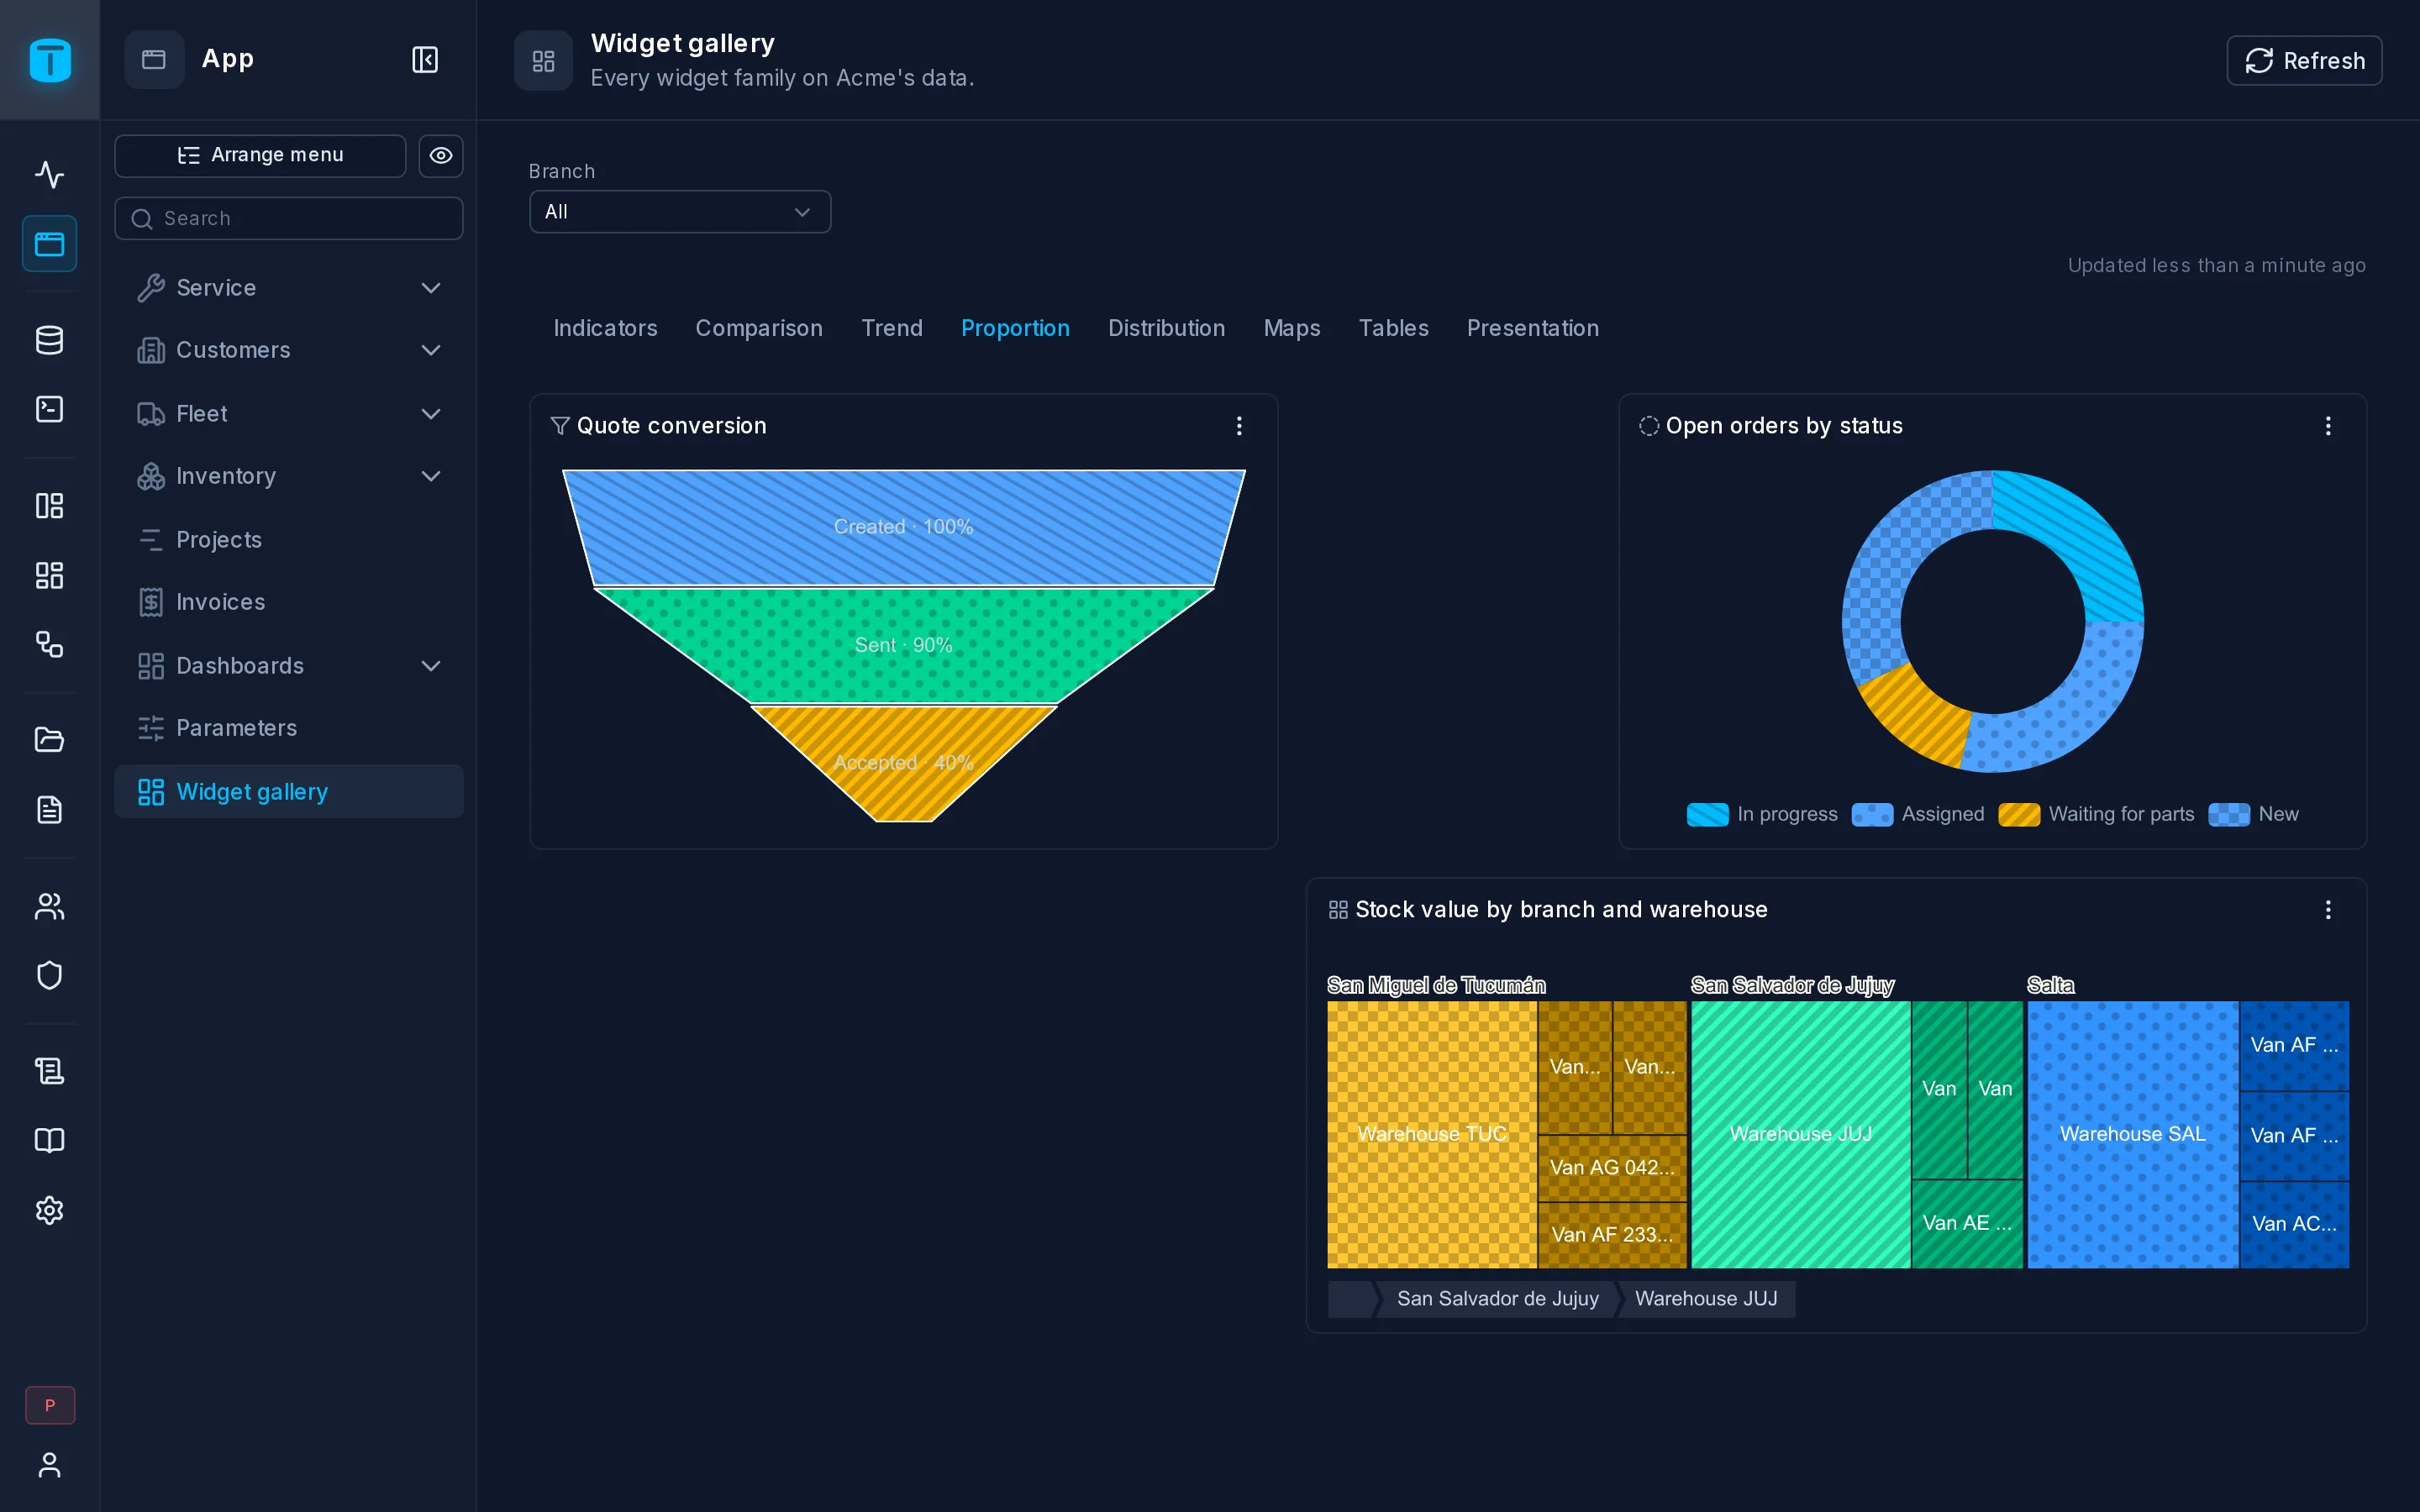
Pie chart and Donut chart
Each row a slice of the whole; a donut is a pie with a hole.
| Role | Takes | Unset |
|---|---|---|
| Category | each slice's name | the first column that isn't a number |
| Value | the slice's size | the first number column |
Open orders by status:
SELECT status, count(*) AS orders
FROM work_orders
WHERE status NOT IN ('COMPLETED', 'CANCELLED')
  AND ($VAR.branch IS NULL OR branch = $VAR.branch::uuid)
GROUP BY status
ORDER BY orders DESC
Each slice is named by the label of its value in the column's presentation (In progress for IN_PROGRESS) and colored by that value's color, unless the query returns a _color. Without either, slices rotate through the palette.
| Setting | |
|---|---|
| Format, Compact number | how values read |
| Color column | a column whose palette name colors each slice; unset, _color |
| Show legend | the slices' names, below the chart. On by default |
| On click | what a click on a slice does |
Pie chart
PIE
Each row a slice of the whole.
Size: 4 × 4 of the 12-column grid, at least 3 × 3 · Also: events, export
| Data | Code | Takes | Required | Unset | |
|---|---|---|---|---|---|
| Category | category | category, time | yes | first | Each slice's name. Defaults to the first column that isn't a number. |
| Value | value | number | yes | first | The slice sizes. Defaults to the first number column. |
| Property | Code | Section | Values | |
|---|---|---|---|---|
| Format | displayFormat | format | How its numbers read - a displayFormat pattern: "$ #,##0", "#,##0.00", "0.0 %" (% never multiplies: 85 reads 85.0 %), "0.0 h", "CURRENCY:ARS". Unset: the value column's own (its presentation), else the locale's. | |
| Compact number | compact | format | Abbreviates large numbers - 11.6M, 2.4K - keeping the format's text and decimals ("$ #,##0" + compact: $ 1.3M). Unset: on, unless a format applies (its own or its column's). | |
| Color column | colorColumn | appearance | A column whose value - a palette name: red, emerald, amber... - colors its row's mark. Unset, a column named _color, if the query returns one. | |
| Show legend | showLegend | appearance | default true | The series' (or slices') names, beside the chart. |
| On click | click | events | What a click on a mark does: {action: "FILTER", variable, value} sets a variable of this dashboard; {action: "DATAVIEW", dataview, filter} opens a DataView filtered (the where grammar); {action: "DASHBOARD", dashboard, variables, tab}; {action: "RECORD", dataview, pk}; {action: "URL", url, newTab, inEmbeds}. Values are formulas over (_ columns too) and ; targets by id. hint: the tooltip's last line. |
SELECT * FROM (VALUES ('Online', 540, 'blue'), ('Stores', 320, 'emerald'), ('Phone', 90, 'amber')) AS t(channel, orders, _color)
Donut chart
DONUT
A pie with a hole - each row a slice of the whole.
Size: 4 × 4 of the 12-column grid, at least 3 × 3 · Also: events, export
| Data | Code | Takes | Required | Unset | |
|---|---|---|---|---|---|
| Category | category | category, time | yes | first | Each slice's name. Defaults to the first column that isn't a number. |
| Value | value | number | yes | first | The slice sizes. Defaults to the first number column. |
| Property | Code | Section | Values | |
|---|---|---|---|---|
| Format | displayFormat | format | How its numbers read - a displayFormat pattern: "$ #,##0", "#,##0.00", "0.0 %" (% never multiplies: 85 reads 85.0 %), "0.0 h", "CURRENCY:ARS". Unset: the value column's own (its presentation), else the locale's. | |
| Compact number | compact | format | Abbreviates large numbers - 11.6M, 2.4K - keeping the format's text and decimals ("$ #,##0" + compact: $ 1.3M). Unset: on, unless a format applies (its own or its column's). | |
| Color column | colorColumn | appearance | A column whose value - a palette name: red, emerald, amber... - colors its row's mark. Unset, a column named _color, if the query returns one. | |
| Show legend | showLegend | appearance | default true | The series' (or slices') names, beside the chart. |
| On click | click | events | What a click on a mark does: {action: "FILTER", variable, value} sets a variable of this dashboard; {action: "DATAVIEW", dataview, filter} opens a DataView filtered (the where grammar); {action: "DASHBOARD", dashboard, variables, tab}; {action: "RECORD", dataview, pk}; {action: "URL", url, newTab, inEmbeds}. Values are formulas over (_ columns too) and ; targets by id. hint: the tooltip's last line. |
SELECT * FROM (VALUES ('Open', 12), ('In progress', 7), ('Resolved', 43)) AS t(status, tickets)
Funnel
Steps in the query's order, each with its share of the first or the previous step.
| Role | Takes | Unset |
|---|---|---|
| Category | each step's name | the first column that isn't a number |
| Value | each step's value, never negative | the first number column |
| Tooltip | more columns in a step's tooltip | none |
Acme's quote conversion. The _step column only orders the rows; columns starting with _ are never shown:
SELECT * FROM (
  SELECT 1 AS _step, 'All quotes' AS stage, count(*) AS quotes FROM quotes
  UNION ALL
  SELECT 2, 'Sent', count(*) FILTER (WHERE status IN ('SENT', 'ACCEPTED', 'REJECTED')) FROM quotes
  UNION ALL
  SELECT 3, 'Accepted', count(*) FILTER (WHERE status = 'ACCEPTED') FROM quotes
) steps
ORDER BY _step
| Setting | |
|---|---|
| Order | The query's order (the default) or Largest first |
| Conversion | each step's percent Of the first step (the default), Of the previous step, or None |
| Format, Compact number, Color column, Show legend, On click | as a pie's. The legend is off by default |
FUNNEL
Steps in the query's order, each with its share of the first or the previous step.
Size: 4 × 4 of the 12-column grid, at least 3 × 3 · Also: events, export
| Data | Code | Takes | Required | Unset | |
|---|---|---|---|---|---|
| Category | category | category, time | yes | first | Each step's name - in the query's order. Defaults to the first column that isn't a number. |
| Value | value | number | yes | first | Each step's value - never negative. Defaults to the first number column. |
| Tooltip | tooltip | category, number, time | none | More columns shown in a mark's tooltip, with their titles and formats. Optional. |
| Property | Code | Section | Values | |
|---|---|---|---|---|
| Format | displayFormat | format | How its numbers read - a displayFormat pattern: "$ #,##0", "#,##0.00", "0.0 %" (% never multiplies: 85 reads 85.0 %), "0.0 h", "CURRENCY:ARS". Unset: the value column's own (its presentation), else the locale's. | |
| Compact number | compact | format | Abbreviates large numbers - 11.6M, 2.4K - keeping the format's text and decimals ("$ #,##0" + compact: $ 1.3M). Unset: on, unless a format applies (its own or its column's). | |
| Color column | colorColumn | appearance | A column whose value - a palette name: red, emerald, amber... - colors its row's mark. Unset, a column named _color, if the query returns one. | |
| Show legend | showLegend | appearance | default false | The series' (or slices') names, beside the chart. |
| Order | sort | appearance | NONE, DESC; default NONE | NONE: the query's order; DESC: the largest first. |
| Conversion | conversion | format | FIRST, PREVIOUS, NONE; default FIRST | Each step's percent of the first step, of the previous one, or none. |
| On click | click | events | What a click on a mark does: {action: "FILTER", variable, value} sets a variable of this dashboard; {action: "DATAVIEW", dataview, filter} opens a DataView filtered (the where grammar); {action: "DASHBOARD", dashboard, variables, tab}; {action: "RECORD", dataview, pk}; {action: "URL", url, newTab, inEmbeds}. Values are formulas over (_ columns too) and ; targets by id. hint: the tooltip's last line. |
SELECT * FROM (VALUES (1, 'Visits', 1200), (2, 'Sign-ups', 480), (3, 'Orders', 210), (4, 'Paid', 160)) AS t(_n, step, people) ORDER BY _n
Treemap
Nested rectangles by levels, each sized by its value. A parent is the sum of its children, so values must add up: a sum or a count, never an average.
| Role | Takes | Unset |
|---|---|---|
| Levels | the hierarchy, outermost first. A NULL ends its branch there | every column that isn't a number |
| Value | a leaf's value, never negative | the first number column |
| Tooltip | more columns in a rectangle's tooltip | none |
Stock value by branch, warehouse and part category:
SELECT b.name AS branch, w.name AS warehouse, p.category,
       sum(s.quantity * p.unit_cost) AS value
FROM stock s
JOIN parts p ON p.id = s.part
JOIN warehouses w ON w.id = s.warehouse
JOIN branches b ON b.id = w.branch
GROUP BY 1, 2, 3
| Setting | |
|---|---|
| Show labels | each rectangle's name in it. On by default |
| Levels shown | how many levels at once, 2 by default. A tap on a parent goes down one, the breadcrumb back |
| Format, Compact number, Color column, On click | as a pie's. With an On click set, a tap runs it instead of zooming in |
TREEMAP
Nested rectangles by levels (branch → category → product), each sized by its value; a parent is the sum of its children.
Size: 6 × 4 of the 12-column grid, at least 3 × 3 · Also: events, export
| Data | Code | Takes | Required | Unset | |
|---|---|---|---|---|---|
| Levels | levels | category, time | yes | all | The hierarchy, outermost first - every column that isn't a number by default. A NULL ends its branch there. |
| Value | value | number | yes | first | A leaf's value - summable (never an average), never negative. Defaults to the first number column. |
| Tooltip | tooltip | category, number, time | none | More columns shown in a mark's tooltip, with their titles and formats. Optional. |
| Property | Code | Section | Values | |
|---|---|---|---|---|
| Format | displayFormat | format | How its numbers read - a displayFormat pattern: "$ #,##0", "#,##0.00", "0.0 %" (% never multiplies: 85 reads 85.0 %), "0.0 h", "CURRENCY:ARS". Unset: the value column's own (its presentation), else the locale's. | |
| Compact number | compact | format | Abbreviates large numbers - 11.6M, 2.4K - keeping the format's text and decimals ("$ #,##0" + compact: $ 1.3M). Unset: on, unless a format applies (its own or its column's). | |
| Color column | colorColumn | appearance | A column whose value - a palette name: red, emerald, amber... - colors its row's mark. Unset, a column named _color, if the query returns one. | |
| Show labels | showLabels | appearance | default true | Each node's name in it. |
| Levels shown | visibleLevels | appearance | default 2 | How many levels at once - a tap goes down one, the breadcrumb back. |
| On click | click | events | What a click on a mark does: {action: "FILTER", variable, value} sets a variable of this dashboard; {action: "DATAVIEW", dataview, filter} opens a DataView filtered (the where grammar); {action: "DASHBOARD", dashboard, variables, tab}; {action: "RECORD", dataview, pk}; {action: "URL", url, newTab, inEmbeds}. Values are formulas over (_ columns too) and ; targets by id. hint: the tooltip's last line. |
SELECT * FROM (VALUES ('North', 'Drinks', 'Water', 120), ('North', 'Drinks', 'Soda', 90), ('North', 'Food', 'Bread', 60), ('South', 'Drinks', 'Water', 70), ('South', 'Food', 'Cheese', 110)) AS t(branch, category, product, sold)
Sunburst
The same as a treemap, as rings: the innermost ring is the first level. Installed equipment by category and status:
SELECT em.category, e.status, count(*) AS units
FROM equipment e
JOIN equipment_models em ON em.id = e.model
WHERE e.status <> 'RETIRED'
GROUP BY 1, 2
Its settings: Show labels, Format, Compact number, Color column and On click.
SUNBURST
Rings by levels, the innermost the first; a parent is the sum of its children.
Size: 4 × 4 of the 12-column grid, at least 3 × 3 · Also: events, export
| Data | Code | Takes | Required | Unset | |
|---|---|---|---|---|---|
| Levels | levels | category, time | yes | all | The hierarchy, innermost ring first - every column that isn't a number by default. A NULL ends its branch there. |
| Value | value | number | yes | first | A leaf's value - summable (never an average), never negative. Defaults to the first number column. |
| Tooltip | tooltip | category, number, time | none | More columns shown in a mark's tooltip, with their titles and formats. Optional. |
| Property | Code | Section | Values | |
|---|---|---|---|---|
| Format | displayFormat | format | How its numbers read - a displayFormat pattern: "$ #,##0", "#,##0.00", "0.0 %" (% never multiplies: 85 reads 85.0 %), "0.0 h", "CURRENCY:ARS". Unset: the value column's own (its presentation), else the locale's. | |
| Compact number | compact | format | Abbreviates large numbers - 11.6M, 2.4K - keeping the format's text and decimals ("$ #,##0" + compact: $ 1.3M). Unset: on, unless a format applies (its own or its column's). | |
| Color column | colorColumn | appearance | A column whose value - a palette name: red, emerald, amber... - colors its row's mark. Unset, a column named _color, if the query returns one. | |
| Show labels | showLabels | appearance | default true | Each node's name on it. |
| On click | click | events | What a click on a mark does: {action: "FILTER", variable, value} sets a variable of this dashboard; {action: "DATAVIEW", dataview, filter} opens a DataView filtered (the where grammar); {action: "DASHBOARD", dashboard, variables, tab}; {action: "RECORD", dataview, pk}; {action: "URL", url, newTab, inEmbeds}. Values are formulas over (_ columns too) and ; targets by id. hint: the tooltip's last line. |
SELECT * FROM (VALUES ('North', 'Drinks', 'Water', 120), ('North', 'Drinks', 'Soda', 90), ('North', 'Food', 'Bread', 60), ('South', 'Drinks', 'Water', 70), ('South', 'Food', 'Cheese', 110)) AS t(branch, category, product, sold)
Next steps
- Distribution and Relation: heatmaps and scatter.
- SQL Conventions: coloring slices from the query.