

Comparison
In the admin: a Dashboard › a widget › Edit
Comparison widgets set values side by side: one bar or row per category. They never sort or cut rows themselves: the order and the LIMIT belong in the query.
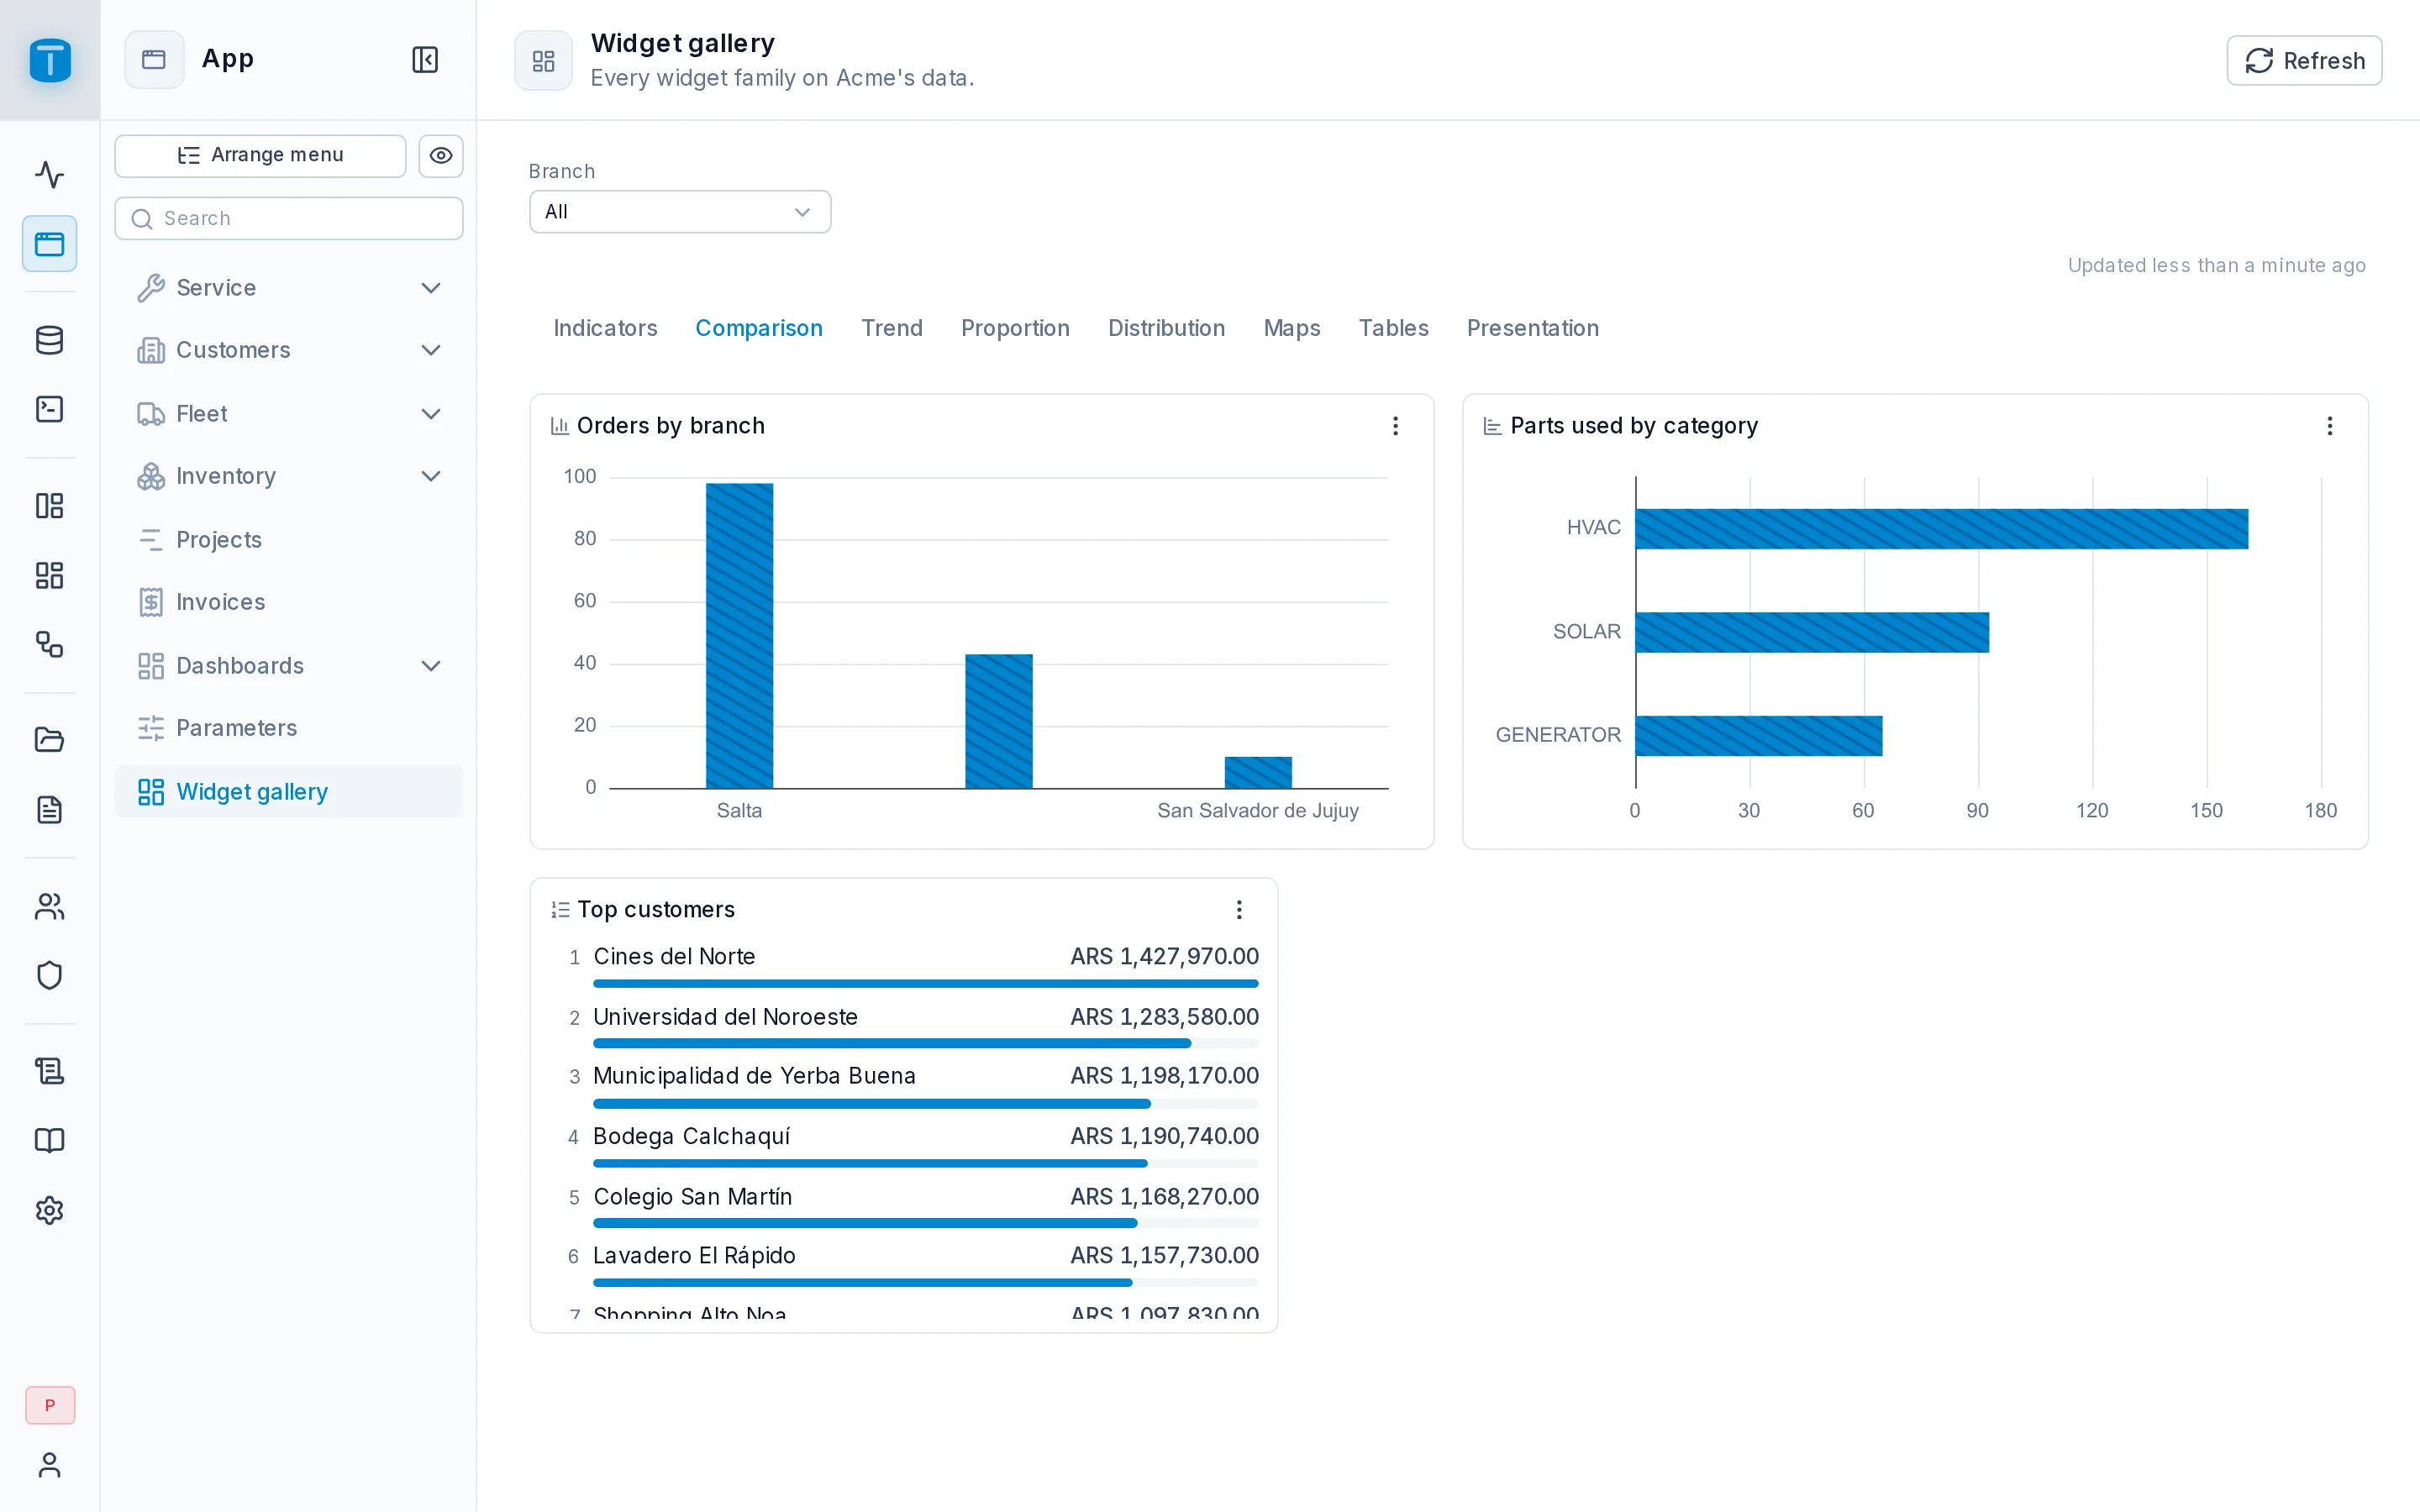
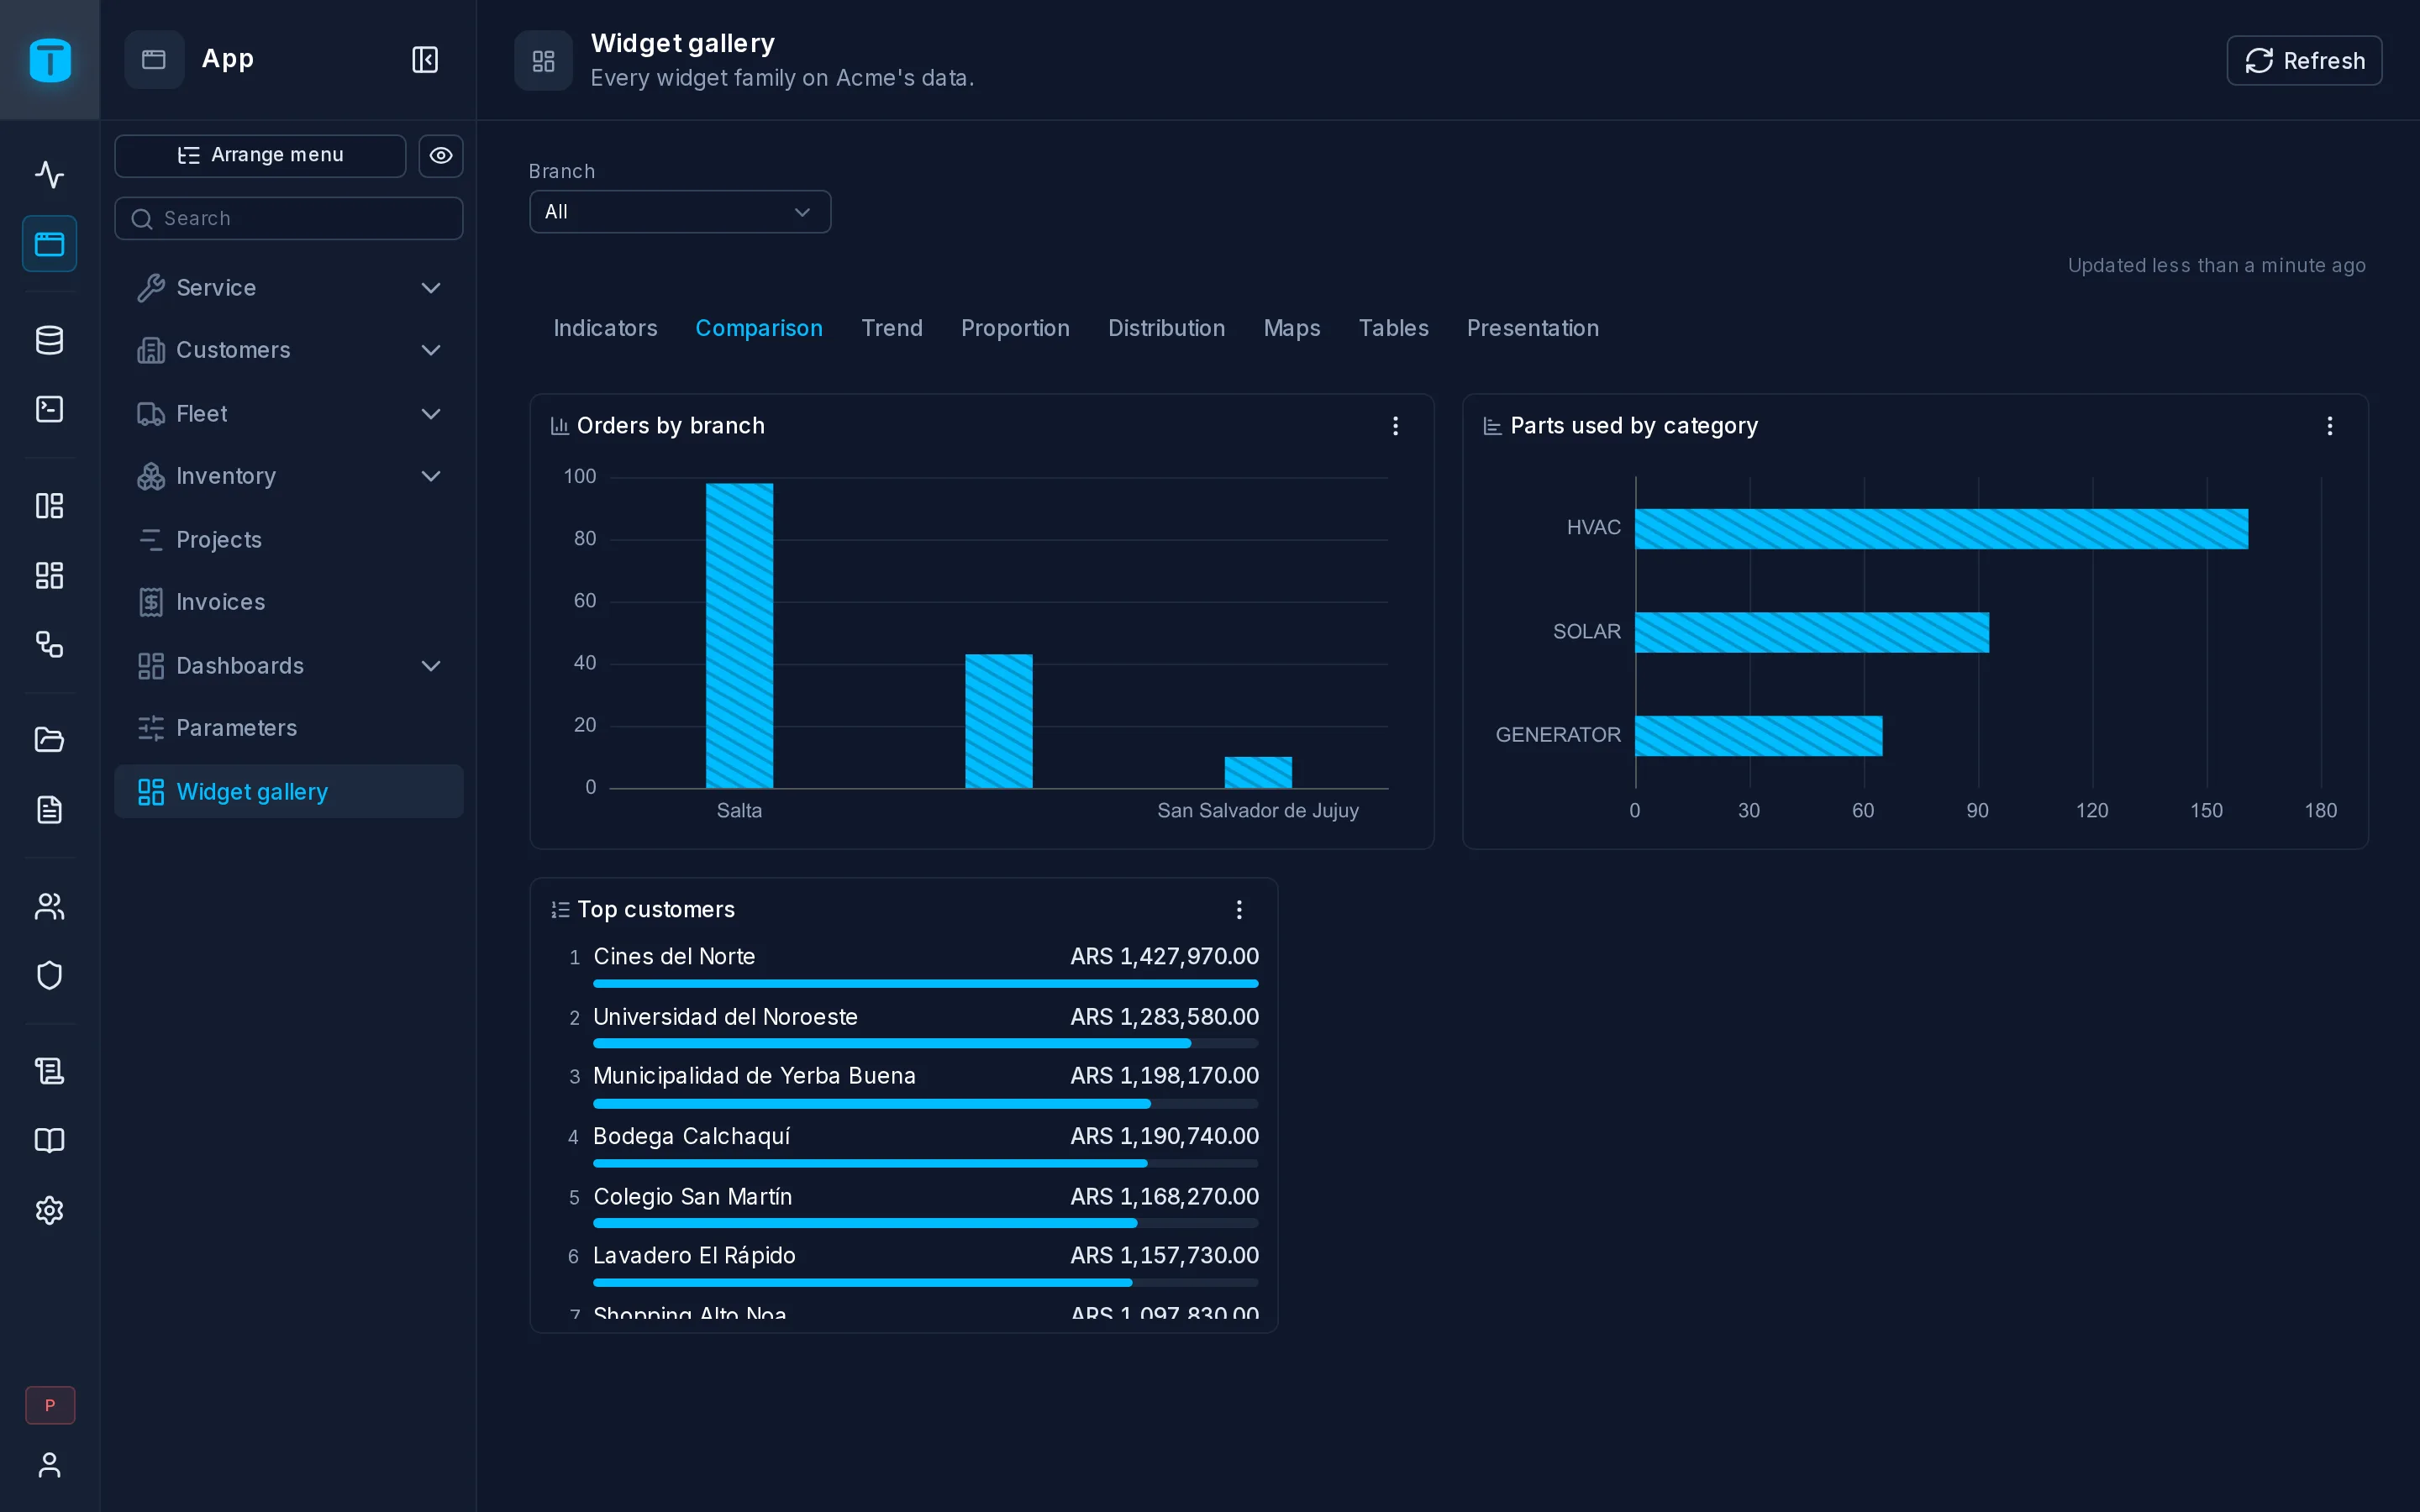
Bar chart
Vertical bars: one group per category, one bar per series.
| Role | Takes | Unset |
|---|---|---|
| Category | the axis labels; a date makes a time axis | the first column that isn't a number |
| Values | one series per column, in order | every number column |
| Series | long format: one series per value of this column, with one value column | none: choose it by hand |
Open and overdue orders per branch, two series as columns (wide format):
SELECT b.name AS branch,
       count(wo.id) FILTER (WHERE wo.status NOT IN ('COMPLETED', 'CANCELLED')) AS open,
       count(wo.id) FILTER (WHERE wo.status NOT IN ('COMPLETED', 'CANCELLED')
                            AND wo.due_at < now()) AS overdue
FROM branches b
LEFT JOIN work_orders wo ON wo.branch = b.id
GROUP BY b.name
ORDER BY b.name
The same data can come as rows (long format): SELECT b.name AS branch, wo.type, count(*) AS orders ... GROUP BY 1, 2 with Series set to type draws a series per order type. A value missing for a category is left empty. Series names and colors come from the column's presentation, such as the labels and colors of type's CHECK list.
| Setting | |
|---|---|
| Stacked | stacks the series instead of placing them side by side |
| Format, Compact number, Color | how values read; the accent color of a single series |
| Color column | a column whose palette name colors each bar; unset, _color. Only with a single value column |
| Show legend | the series' names. A single series hides it |
| Series | per series: its name, color, type (bar, line or area), axis (left or right) and format. Types mix in one chart, and a series on the right axis reads on its own scale |
| Axes | each axis' title; the value axes' minimum, maximum, logarithmic scale and format. Unset minimum: 0 |
| Reference lines | lines at a number, a statistic of a series (average, minimum, maximum, median), a column or a variable, and bands between two values |
| On click, Zoom | a click on a bar; a zoom slider under the chart, the wheel or a pinch |
BAR
Vertical bars - one group per category, one bar per series.
Size: 6 × 4 of the 12-column grid, at least 3 × 3 · Also: series, thresholds, events, zoom, export
| Data | Code | Takes | Required | Unset | |
|---|---|---|---|---|---|
| Category | category | category, time | yes | first | The axis labels - a date makes a time axis. Defaults to the first column that isn't a number. |
| Values | values | number | yes | all | One series per column, in this order. Defaults to every number column. |
| Series | series | category | none | Long format: one series per value of this column (month, seller, total) - with one value column. Optional. |
| Property | Code | Section | Values | |
|---|---|---|---|---|
| Stacked | stacked | appearance | default false | Stacks the series instead of placing them side by side. |
| Format | displayFormat | format | How its numbers read - a displayFormat pattern: "$ #,##0", "#,##0.00", "0.0 %" (% never multiplies: 85 reads 85.0 %), "0.0 h", "CURRENCY:ARS". Unset: the value column's own (its presentation), else the locale's. | |
| Compact number | compact | format | Abbreviates large numbers - 11.6M, 2.4K - keeping the format's text and decimals ("$ #,##0" + compact: $ 1.3M). Unset: on, unless a format applies (its own or its column's). | |
| Color | color | appearance | A palette hue for its marks - unset, the theme's primary. | |
| Color column | colorColumn | appearance | A column whose value - a palette name: red, emerald, amber... - colors its row's mark. Unset, a column named _color, if the query returns one. | |
| Show legend | showLegend | appearance | default true | The series' (or slices') names, beside the chart. |
| Series | series | series | Per value column - or, in long format, per value of the Series column: {label, color (a palette hue), type: bar|line|area, axis: left|right, displayFormat}. Unset: the column's title and format; in long format, the Series column's value labels and colors (its presentation). | |
| Axes | axes | axes | {category: {title}, value: {title, min, max, log, displayFormat}, value2: {...}} - value2 is the right axis, used by series with axis: right. Unset min: 0 for bars and areas, fitted to the data for lines. | |
| Reference lines | references | thresholds | Lines and bands on the value axis: {type: "line", value: a number | average | min | max | median | {column} | {variable}, label, color, series?} or {type: "band", from, to, label, color}. Labels read in the axis' format. | |
| On click | click | events | What a click on a mark does: {action: "FILTER", variable, value} sets a variable of this dashboard; {action: "DATAVIEW", dataview, filter} opens a DataView filtered (the where grammar); {action: "DASHBOARD", dashboard, variables, tab}; {action: "RECORD", dataview, pk}; {action: "URL", url, newTab, inEmbeds}. Values are formulas over (_ columns too) and ; targets by id. hint: the tooltip's last line. | |
| Zoom | zoom | zoomExport | default false | A bar under the chart, and the wheel or a pinch, to zoom into a range. |
SELECT * FROM (VALUES ('North', 120, 80), ('South', 95, 110), ('East', 140, 60), ('West', 70, 90)) AS t(region, sales, returns)
Horizontal bar
The same roles and settings, with bars across: for long labels. Categories read top to bottom in the query's order. Parts used on work orders by category:
SELECT p.category, sum(-m.quantity) AS used
FROM stock_movements m
JOIN parts p ON p.id = m.part
WHERE m.reason = 'WORK_ORDER'
  AND ($VAR.period.from IS NULL OR m.created_at >= $VAR.period.from)
  AND ($VAR.period.to IS NULL OR m.created_at < $VAR.period.to)
GROUP BY p.category
ORDER BY used DESC
BAR_HORIZONTAL
Horizontal bars - for long labels; order the query yourself.
Size: 6 × 4 of the 12-column grid, at least 3 × 3 · Also: series, thresholds, events, zoom, export
| Data | Code | Takes | Required | Unset | |
|---|---|---|---|---|---|
| Category | category | category, time | yes | first | The axis labels - a date makes a time axis. Defaults to the first column that isn't a number. |
| Values | values | number | yes | all | One series per column, in this order. Defaults to every number column. |
| Series | series | category | none | Long format: one series per value of this column (month, seller, total) - with one value column. Optional. |
| Property | Code | Section | Values | |
|---|---|---|---|---|
| Stacked | stacked | appearance | default false | Stacks the series instead of placing them side by side. |
| Format | displayFormat | format | How its numbers read - a displayFormat pattern: "$ #,##0", "#,##0.00", "0.0 %" (% never multiplies: 85 reads 85.0 %), "0.0 h", "CURRENCY:ARS". Unset: the value column's own (its presentation), else the locale's. | |
| Compact number | compact | format | Abbreviates large numbers - 11.6M, 2.4K - keeping the format's text and decimals ("$ #,##0" + compact: $ 1.3M). Unset: on, unless a format applies (its own or its column's). | |
| Color | color | appearance | A palette hue for its marks - unset, the theme's primary. | |
| Color column | colorColumn | appearance | A column whose value - a palette name: red, emerald, amber... - colors its row's mark. Unset, a column named _color, if the query returns one. | |
| Show legend | showLegend | appearance | default true | The series' (or slices') names, beside the chart. |
| Series | series | series | Per value column - or, in long format, per value of the Series column: {label, color (a palette hue), type: bar|line|area, axis: left|right, displayFormat}. Unset: the column's title and format; in long format, the Series column's value labels and colors (its presentation). | |
| Axes | axes | axes | {category: {title}, value: {title, min, max, log, displayFormat}, value2: {...}} - value2 is the right axis, used by series with axis: right. Unset min: 0 for bars and areas, fitted to the data for lines. | |
| Reference lines | references | thresholds | Lines and bands on the value axis: {type: "line", value: a number | average | min | max | median | {column} | {variable}, label, color, series?} or {type: "band", from, to, label, color}. Labels read in the axis' format. | |
| On click | click | events | What a click on a mark does: {action: "FILTER", variable, value} sets a variable of this dashboard; {action: "DATAVIEW", dataview, filter} opens a DataView filtered (the where grammar); {action: "DASHBOARD", dashboard, variables, tab}; {action: "RECORD", dataview, pk}; {action: "URL", url, newTab, inEmbeds}. Values are formulas over (_ columns too) and ; targets by id. hint: the tooltip's last line. | |
| Zoom | zoom | zoomExport | default false | A bar under the chart, and the wheel or a pinch, to zoom into a range. |
SELECT * FROM (VALUES ('Laptops', 320), ('Phones', 280), ('Tablets', 150), ('Monitors', 90)) AS t(product, stock) ORDER BY stock DESC
Combo chart
Bars and lines on two axes: the first value column as bars on the left axis, the rest as lines on the right, each axis in its own format. It needs at least two value columns and no Series column; for a series per value of a column, use a Bar chart. Series changes which is which.
Orders per month as bars, hours per order as a line:
SELECT date_trunc('month', wo.reported_at)::date AS month,
       count(DISTINCT wo.id) AS orders,
       round(sum(te.minutes) / 60.0 / nullif(count(DISTINCT wo.id), 0), 1) AS hours_per_order
FROM work_orders wo
LEFT JOIN time_entries te ON te.work_order = wo.id
WHERE wo.reported_at >= date_trunc('month', current_date) - interval '11 months'
GROUP BY 1
ORDER BY 1
A Tooltip role adds more columns to each mark's tooltip.
COMBO
Bars and lines on two axes - the first value column as bars on the left, the rest as lines on the right.
Size: 6 × 4 of the 12-column grid, at least 3 × 3 · Also: series, thresholds, events, zoom, export
| Data | Code | Takes | Required | Unset | |
|---|---|---|---|---|---|
| Category | category | category, time | yes | first | The axis labels - a date makes a time axis. Defaults to the first column that isn't a number. |
| Values | values | number | yes | all | Two or more columns: the first as bars (left axis), the rest as lines (right axis) - series changes that. |
| Tooltip | tooltip | category, number, time | none | More columns shown in a mark's tooltip, with their titles and formats. Optional. |
| Property | Code | Section | Values | |
|---|---|---|---|---|
| Stacked | stacked | appearance | default false | Stacks the series instead of placing them side by side. |
| Format | displayFormat | format | How its numbers read - a displayFormat pattern: "$ #,##0", "#,##0.00", "0.0 %" (% never multiplies: 85 reads 85.0 %), "0.0 h", "CURRENCY:ARS". Unset: the value column's own (its presentation), else the locale's. | |
| Compact number | compact | format | Abbreviates large numbers - 11.6M, 2.4K - keeping the format's text and decimals ("$ #,##0" + compact: $ 1.3M). Unset: on, unless a format applies (its own or its column's). | |
| Color | color | appearance | A palette hue for its marks - unset, the theme's primary. | |
| Color column | colorColumn | appearance | A column whose value - a palette name: red, emerald, amber... - colors its row's mark. Unset, a column named _color, if the query returns one. | |
| Show legend | showLegend | appearance | default true | The series' (or slices') names, beside the chart. |
| Series | series | series | Per value column - or, in long format, per value of the Series column: {label, color (a palette hue), type: bar|line|area, axis: left|right, displayFormat}. Unset: the column's title and format; in long format, the Series column's value labels and colors (its presentation). | |
| Axes | axes | axes | {category: {title}, value: {title, min, max, log, displayFormat}, value2: {...}} - value2 is the right axis, used by series with axis: right. Unset min: 0 for bars and areas, fitted to the data for lines. | |
| Reference lines | references | thresholds | Lines and bands on the value axis: {type: "line", value: a number | average | min | max | median | {column} | {variable}, label, color, series?} or {type: "band", from, to, label, color}. Labels read in the axis' format. | |
| On click | click | events | What a click on a mark does: {action: "FILTER", variable, value} sets a variable of this dashboard; {action: "DATAVIEW", dataview, filter} opens a DataView filtered (the where grammar); {action: "DASHBOARD", dashboard, variables, tab}; {action: "RECORD", dataview, pk}; {action: "URL", url, newTab, inEmbeds}. Values are formulas over (_ columns too) and ; targets by id. hint: the tooltip's last line. | |
| Zoom | zoom | zoomExport | default false | A bar under the chart, and the wheel or a pinch, to zoom into a range. |
SELECT * FROM (VALUES ('Jan', 120, 3500.5), ('Feb', 140, 3720), ('Mar', 95, 4010.25)) AS t(month, visits, avg_ticket)
Waterfall
How a total is built: each row a change up or down, with its sign.
| Role | Takes | Unset |
|---|---|---|
| Category | each step's name | the first column that isn't a number |
| Value | the change, with its sign | the first number column |
| Total | chosen by hand: a true/false column. A true row draws the running total so far from 0 | none |
The value of Acme's stock movements this month, by reason:
SELECT m.reason, sum(m.quantity * p.unit_cost) AS value
FROM stock_movements m
JOIN parts p ON p.id = m.part
WHERE m.created_at >= date_trunc('month', now())
GROUP BY m.reason
ORDER BY CASE m.reason WHEN 'PURCHASE' THEN 1 WHEN 'TRANSFER' THEN 2
                       WHEN 'ADJUSTMENT' THEN 3 ELSE 4 END
| Setting | |
|---|---|
| Final total, Final total's name | a last bar with the running total, on by default; its name, unset Total |
| Increase color, Decrease color, Total color | palette hues; green and red by default |
WATERFALL
How a total is built - each row a change up or down; a total row the running sum so far.
Size: 6 × 4 of the 12-column grid, at least 3 × 3 · Also: thresholds, events, export
| Data | Code | Takes | Required | Unset | |
|---|---|---|---|---|---|
| Category | category | category, time | yes | first | The axis labels - a date makes a time axis. Defaults to the first column that isn't a number. |
| Value | value | number | yes | first | Each row's change, with its sign. Defaults to the first number column. |
| Total | total | none | Chosen by hand: a true/false column - a true row draws the running total so far from 0 (its value is ignored). | ||
| Tooltip | tooltip | category, number, time | none | More columns shown in a mark's tooltip, with their titles and formats. Optional. |
| Property | Code | Section | Values | |
|---|---|---|---|---|
| Format | displayFormat | format | How its numbers read - a displayFormat pattern: "$ #,##0", "#,##0.00", "0.0 %" (% never multiplies: 85 reads 85.0 %), "0.0 h", "CURRENCY:ARS". Unset: the value column's own (its presentation), else the locale's. | |
| Compact number | compact | format | Abbreviates large numbers - 11.6M, 2.4K - keeping the format's text and decimals ("$ #,##0" + compact: $ 1.3M). Unset: on, unless a format applies (its own or its column's). | |
| Final total | finalTotal | appearance | default true | A last bar with the running total. |
| Final total's name | finalTotalLabel | appearance | Unset: "Total" in the viewer's language. | |
| Increase color | increaseColor | appearance | default green | A palette hue for a change up. |
| Decrease color | decreaseColor | appearance | default red | A palette hue for a change down. |
| Total color | totalColor | appearance | A palette hue for a total - unset, the theme's primary. | |
| Axes | axes | axes | {category: {title}, value: {title, min, max, log, displayFormat}, value2: {...}} - value2 is the right axis, used by series with axis: right. Unset min: 0 for bars and areas, fitted to the data for lines. | |
| Reference lines | references | thresholds | Lines and bands on the value axis: {type: "line", value: a number | average | min | max | median | {column} | {variable}, label, color, series?} or {type: "band", from, to, label, color}. Labels read in the axis' format. | |
| On click | click | events | What a click on a mark does: {action: "FILTER", variable, value} sets a variable of this dashboard; {action: "DATAVIEW", dataview, filter} opens a DataView filtered (the where grammar); {action: "DASHBOARD", dashboard, variables, tab}; {action: "RECORD", dataview, pk}; {action: "URL", url, newTab, inEmbeds}. Values are formulas over (_ columns too) and ; targets by id. hint: the tooltip's last line. |
SELECT * FROM (VALUES (1, 'Sales', 1000, false), (2, 'Discounts', -150, false), (3, 'Net', NULL, true), (4, 'Paid', -600, false)) AS t(n, step, amount, is_total) ORDER BY n
Leaderboard
A ranked list with a bar per row, sized against the largest value. Rows show in the query's order: order and LIMIT it yourself.
| Role | Takes | Unset |
|---|---|---|
| Category | each row's name | the first column that isn't a number |
| Value | the ranked value | the first number column |
| Image | a file column, shown as a thumbnail beside each row | the first file column |
The top ten customers by billing in the chosen period:
SELECT c.name AS customer, sum(ii.quantity * ii.unit_price) AS billed
FROM invoices i
JOIN customers c ON c.id = i.customer
JOIN invoice_items ii ON ii.invoice = i.id
WHERE i.status <> 'DRAFT'
  AND ($VAR.period.from IS NULL OR i.issued_on >= $VAR.period.from)
  AND ($VAR.period.to IS NULL OR i.issued_on < $VAR.period.to)
GROUP BY c.name
ORDER BY billed DESC
LIMIT 10
Its settings: Format, Compact number, Color, Color column and On click (a click on a row).
LEADERBOARD
A ranked list with bars - order and LIMIT the query yourself.
Size: 4 × 4 of the 12-column grid, at least 3 × 3 · Also: events, export
| Data | Code | Takes | Required | Unset | |
|---|---|---|---|---|---|
| Category | category | category, time | yes | first | Each row's name. Defaults to the first column that isn't a number. |
| Value | value | number | yes | first | The ranked value. Defaults to the first number column. |
| Image | image | file | first | A file column (an image) shown as a thumbnail beside each row. Defaults to the first file column. |
| Property | Code | Section | Values | |
|---|---|---|---|---|
| Format | displayFormat | format | How its numbers read - a displayFormat pattern: "$ #,##0", "#,##0.00", "0.0 %" (% never multiplies: 85 reads 85.0 %), "0.0 h", "CURRENCY:ARS". Unset: the value column's own (its presentation), else the locale's. | |
| Compact number | compact | format | Abbreviates large numbers - 11.6M, 2.4K - keeping the format's text and decimals ("$ #,##0" + compact: $ 1.3M). Unset: on, unless a format applies (its own or its column's). | |
| Color | color | appearance | A palette hue for its marks - unset, the theme's primary. | |
| Color column | colorColumn | appearance | A column whose value - a palette name: red, emerald, amber... - colors its row's mark. Unset, a column named _color, if the query returns one. | |
| On click | click | events | What a click on a mark does: {action: "FILTER", variable, value} sets a variable of this dashboard; {action: "DATAVIEW", dataview, filter} opens a DataView filtered (the where grammar); {action: "DASHBOARD", dashboard, variables, tab}; {action: "RECORD", dataview, pk}; {action: "URL", url, newTab, inEmbeds}. Values are formulas over (_ columns too) and ; targets by id. hint: the tooltip's last line. |
SELECT * FROM (VALUES ('Ana', 48), ('Luis', 41), ('Marta', 35), ('Pedro', 22)) AS t(agent, resolved) ORDER BY resolved DESC LIMIT 10
Next steps
- Trend: lines and areas over time.
- SQL Conventions:
_colorand the other helper columns.