

Editor
In the admin: a Dashboard
Clicking a dashboard in the list opens its editor: the draft's widgets on a canvas, running live against your database. The palette of widgets is on the left, the variables bar and the tabs above the canvas.
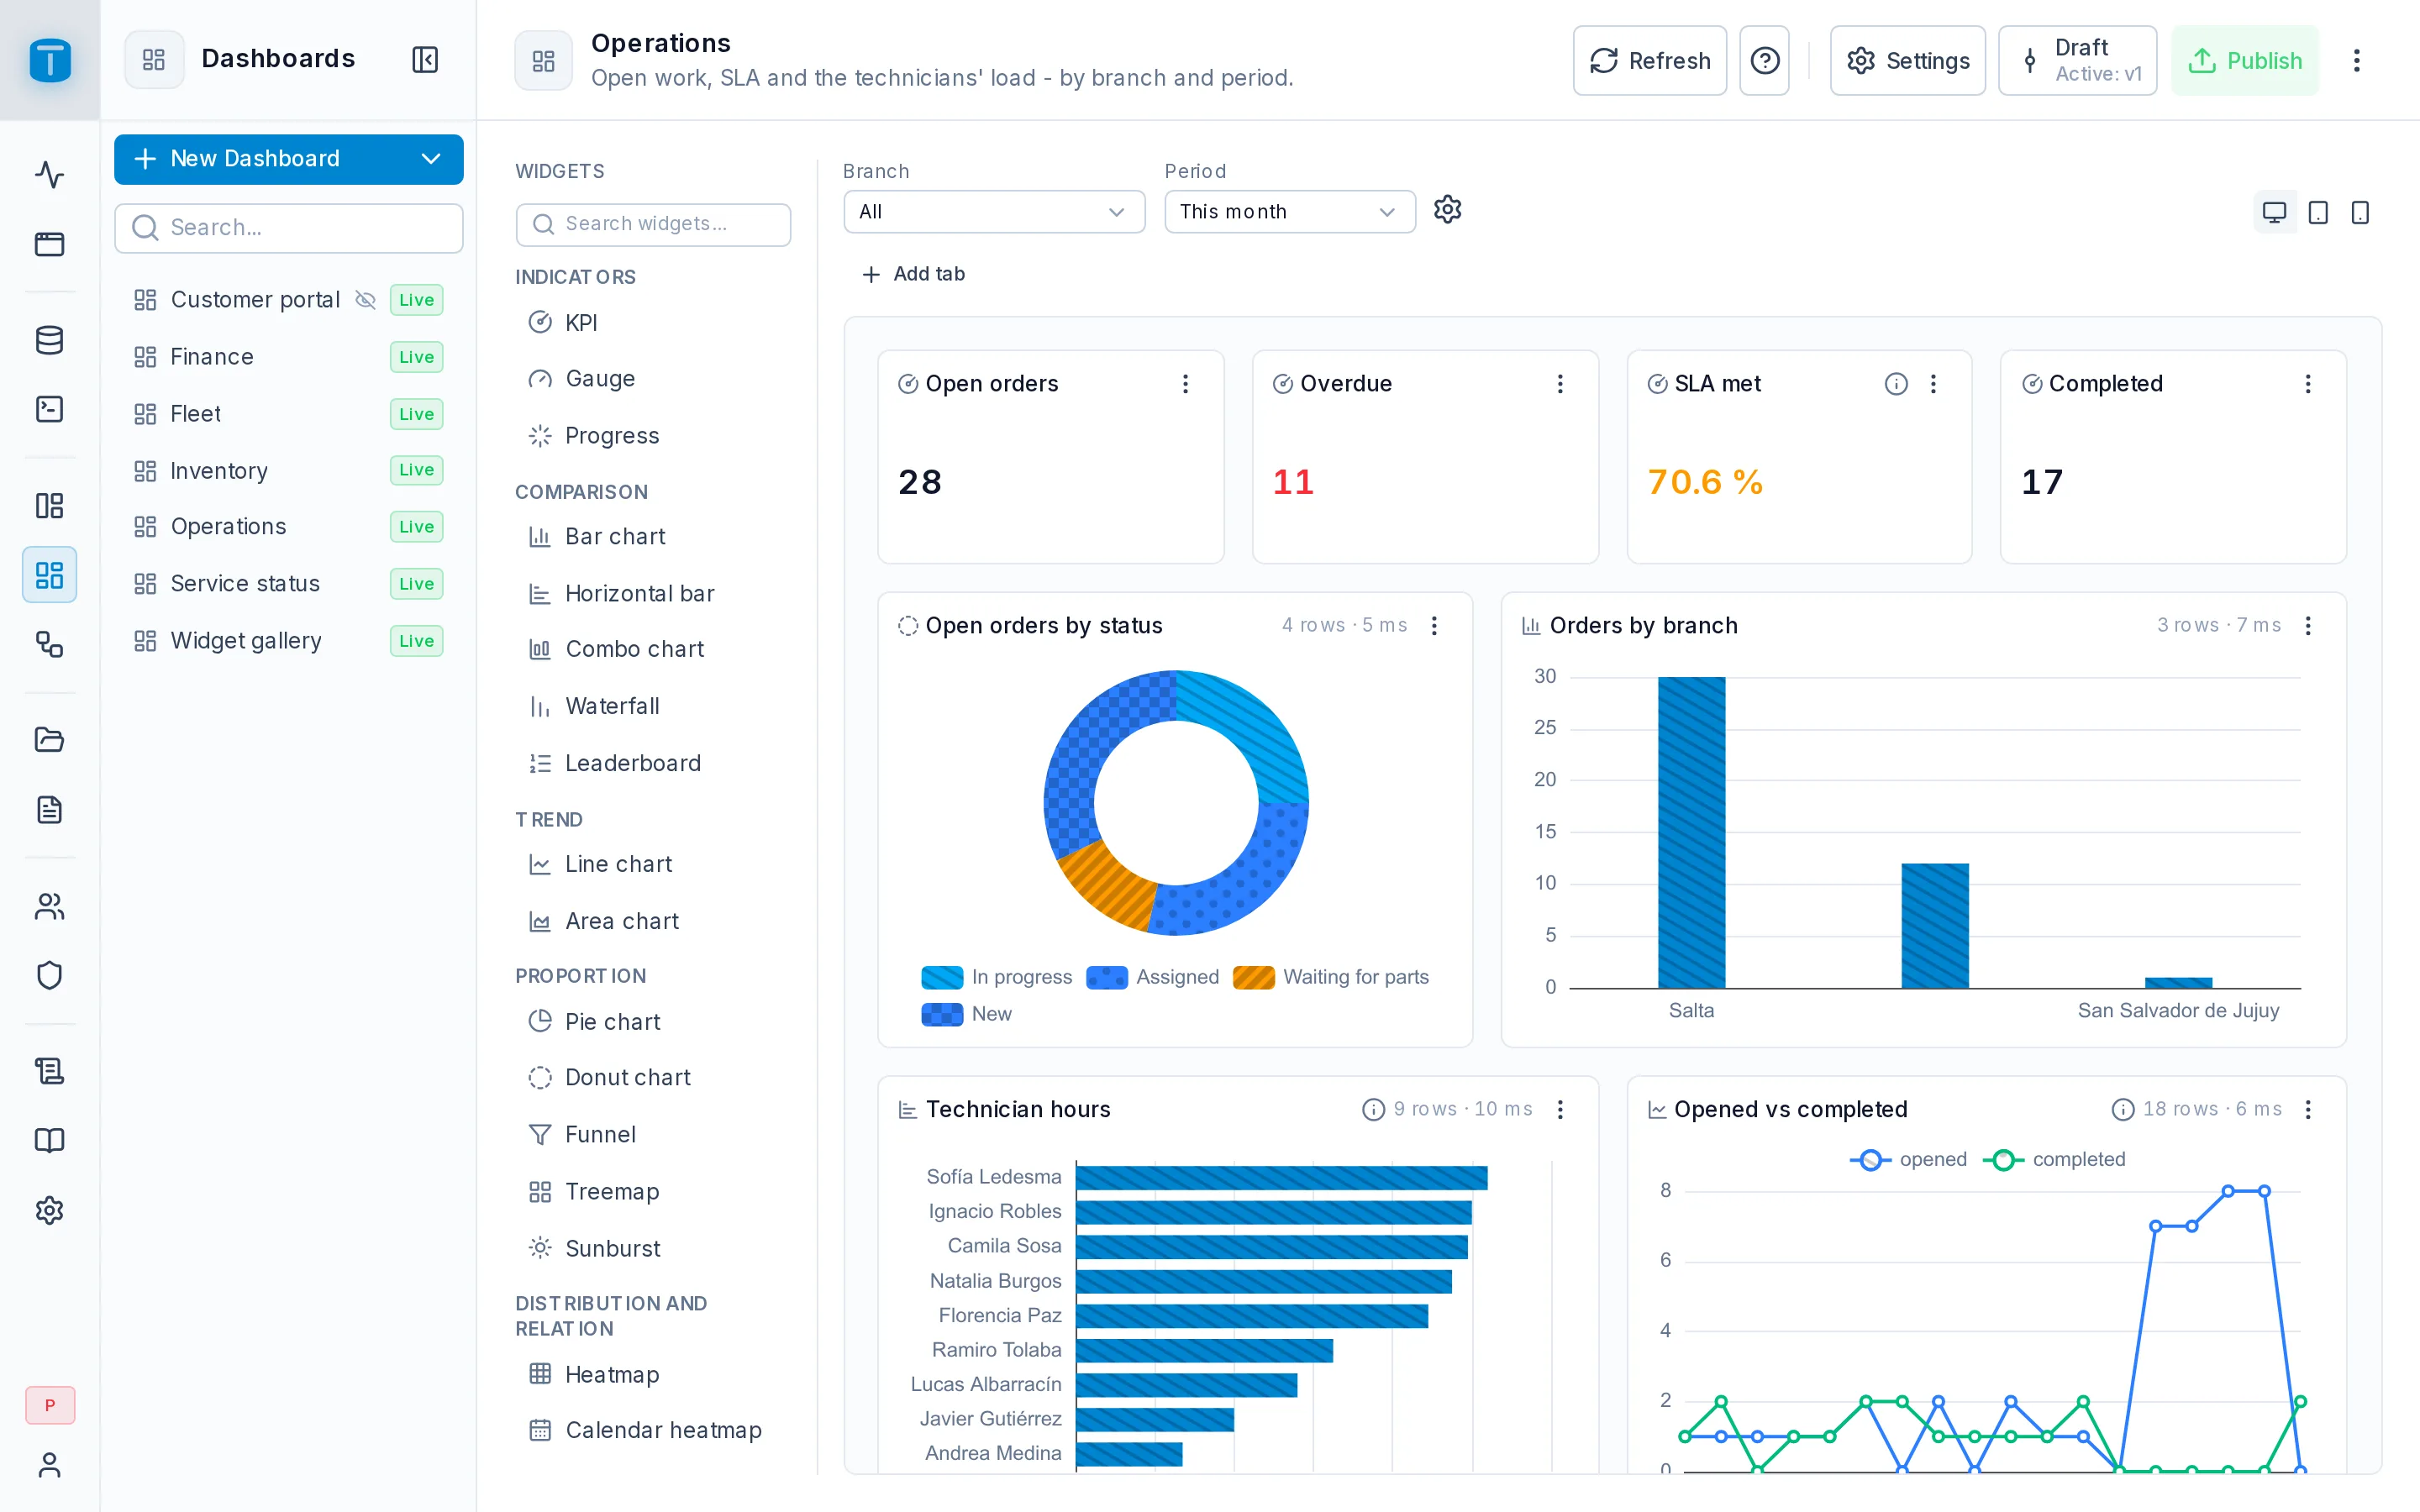
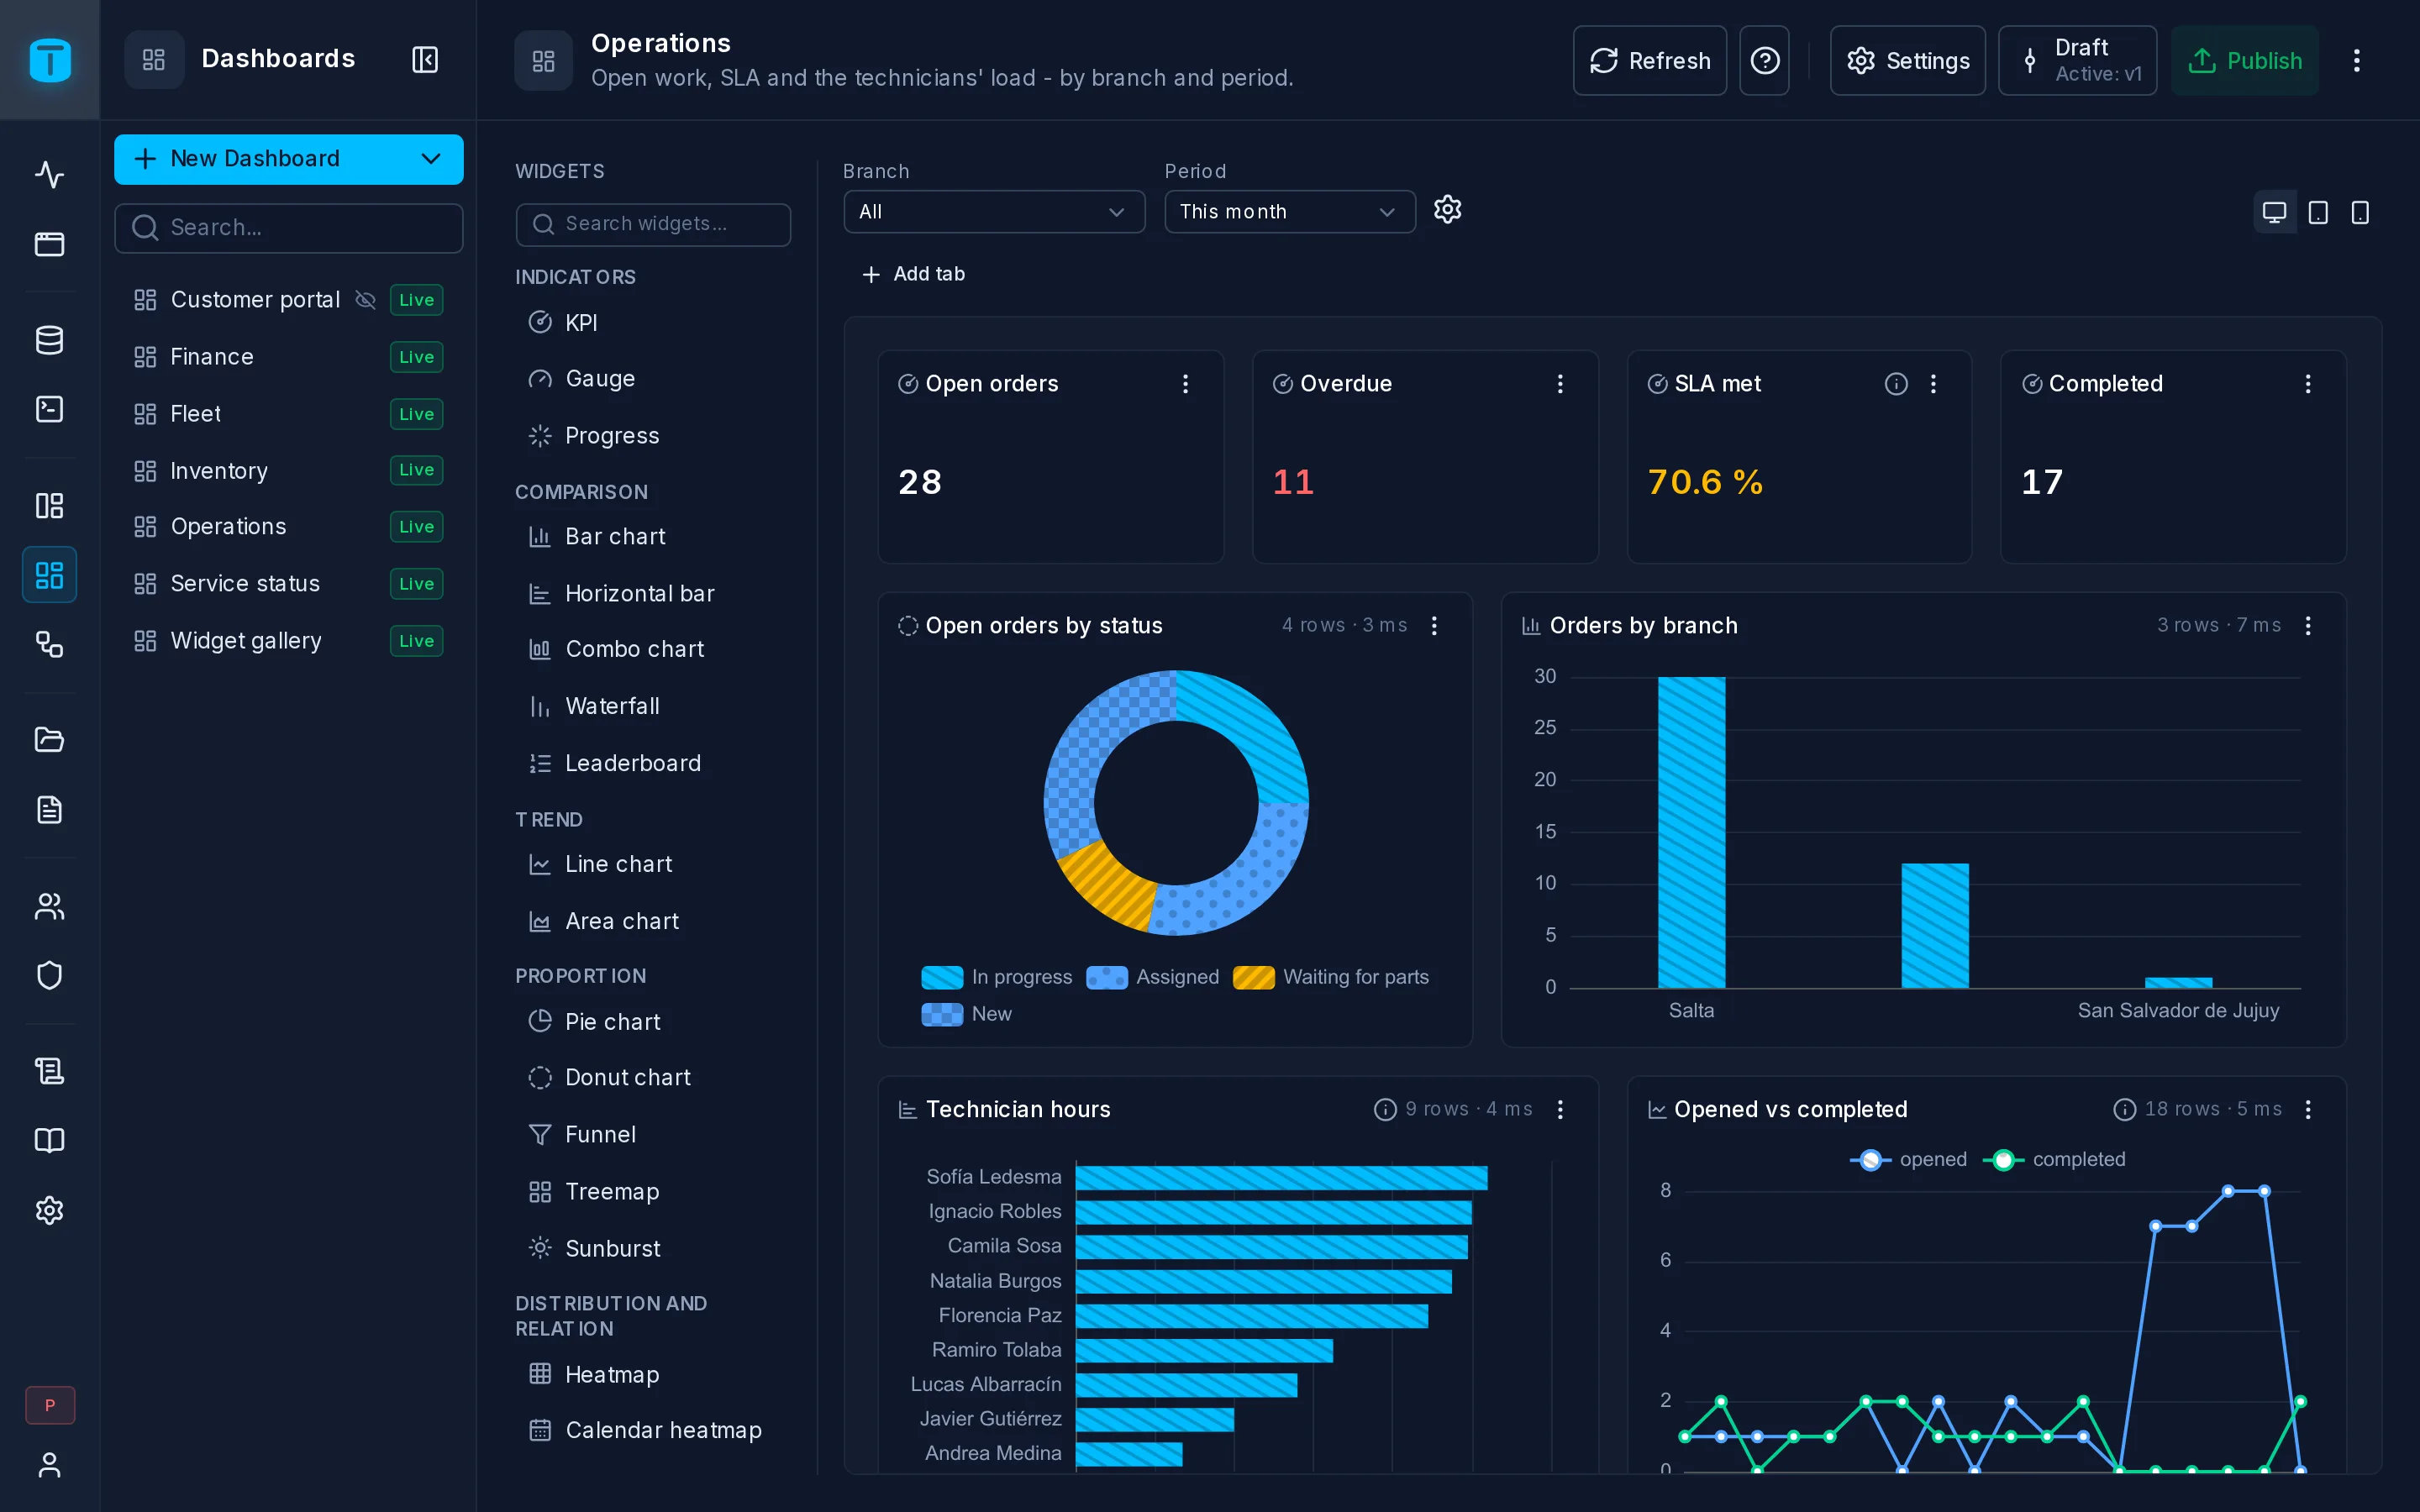
The header
| Status | Saving…, Saved. Every change on the canvas is written to the draft at once. After a failed save, Retry reloads the draft as the server has it |
| Settings | opens the dashboard's settings |
| Unpublished | the draft differs from the live version |
| Versions | the history; opening a version shows it on the canvas, read-only |
| Publish | publishes the draft as the next version. Disabled while there's nothing to publish |
| Refresh | runs every widget again |
| ⋮ | Duplicate… and Delete… |
Duplicate… creates a copy of the draft, widgets and variables included, with a new name and slug. The copy is unpublished, granted to no role and has no embeds. Delete… removes the dashboard, its widgets and every version, after you tick Confirm.
Adding widgets
The Widgets palette lists every widget by group, with a search: Indicators, Comparison, Trend, Proportion, Distribution and relation, Maps, Tables, Visualization and Insertion. Hovering one shows what it's for. Clicking it adds it at the bottom of the canvas, at its starting size.
A new data widget has no query yet: its card says Not configured, with Configure. Presentation widgets, such as a Heading or a Text, draw at once. See Widgets for what each one takes.
The canvas
The canvas is a grid of 12 columns with rows 72 pixels high. On each card:
- The header shows the widget's icon and title. Drag a card by its header; the body stays free for a chart's tooltips and a table's scroll. Double-click the header to edit the widget.
- The corner resizes it. A widget can't be made smaller than its type reads well at.
- Rows and time: on a card wider than a quarter of the canvas, 12 rows · 85 ms. A query over a second is marked, with a hint: for a large table, a materialized view refreshed on a schedule helps.
- A warning triangle when the result was cut at the row cap: Showing the first 1000 rows.
- ⋮: Edit, Duplicate (a copy at the bottom, with its query and settings), Move to tab when the dashboard has tabs, and Delete… (asks first, with Confirm).
The canvas runs each widget's saved query with the variables bar's values, as you, the administrator. $USER in the editor is you.
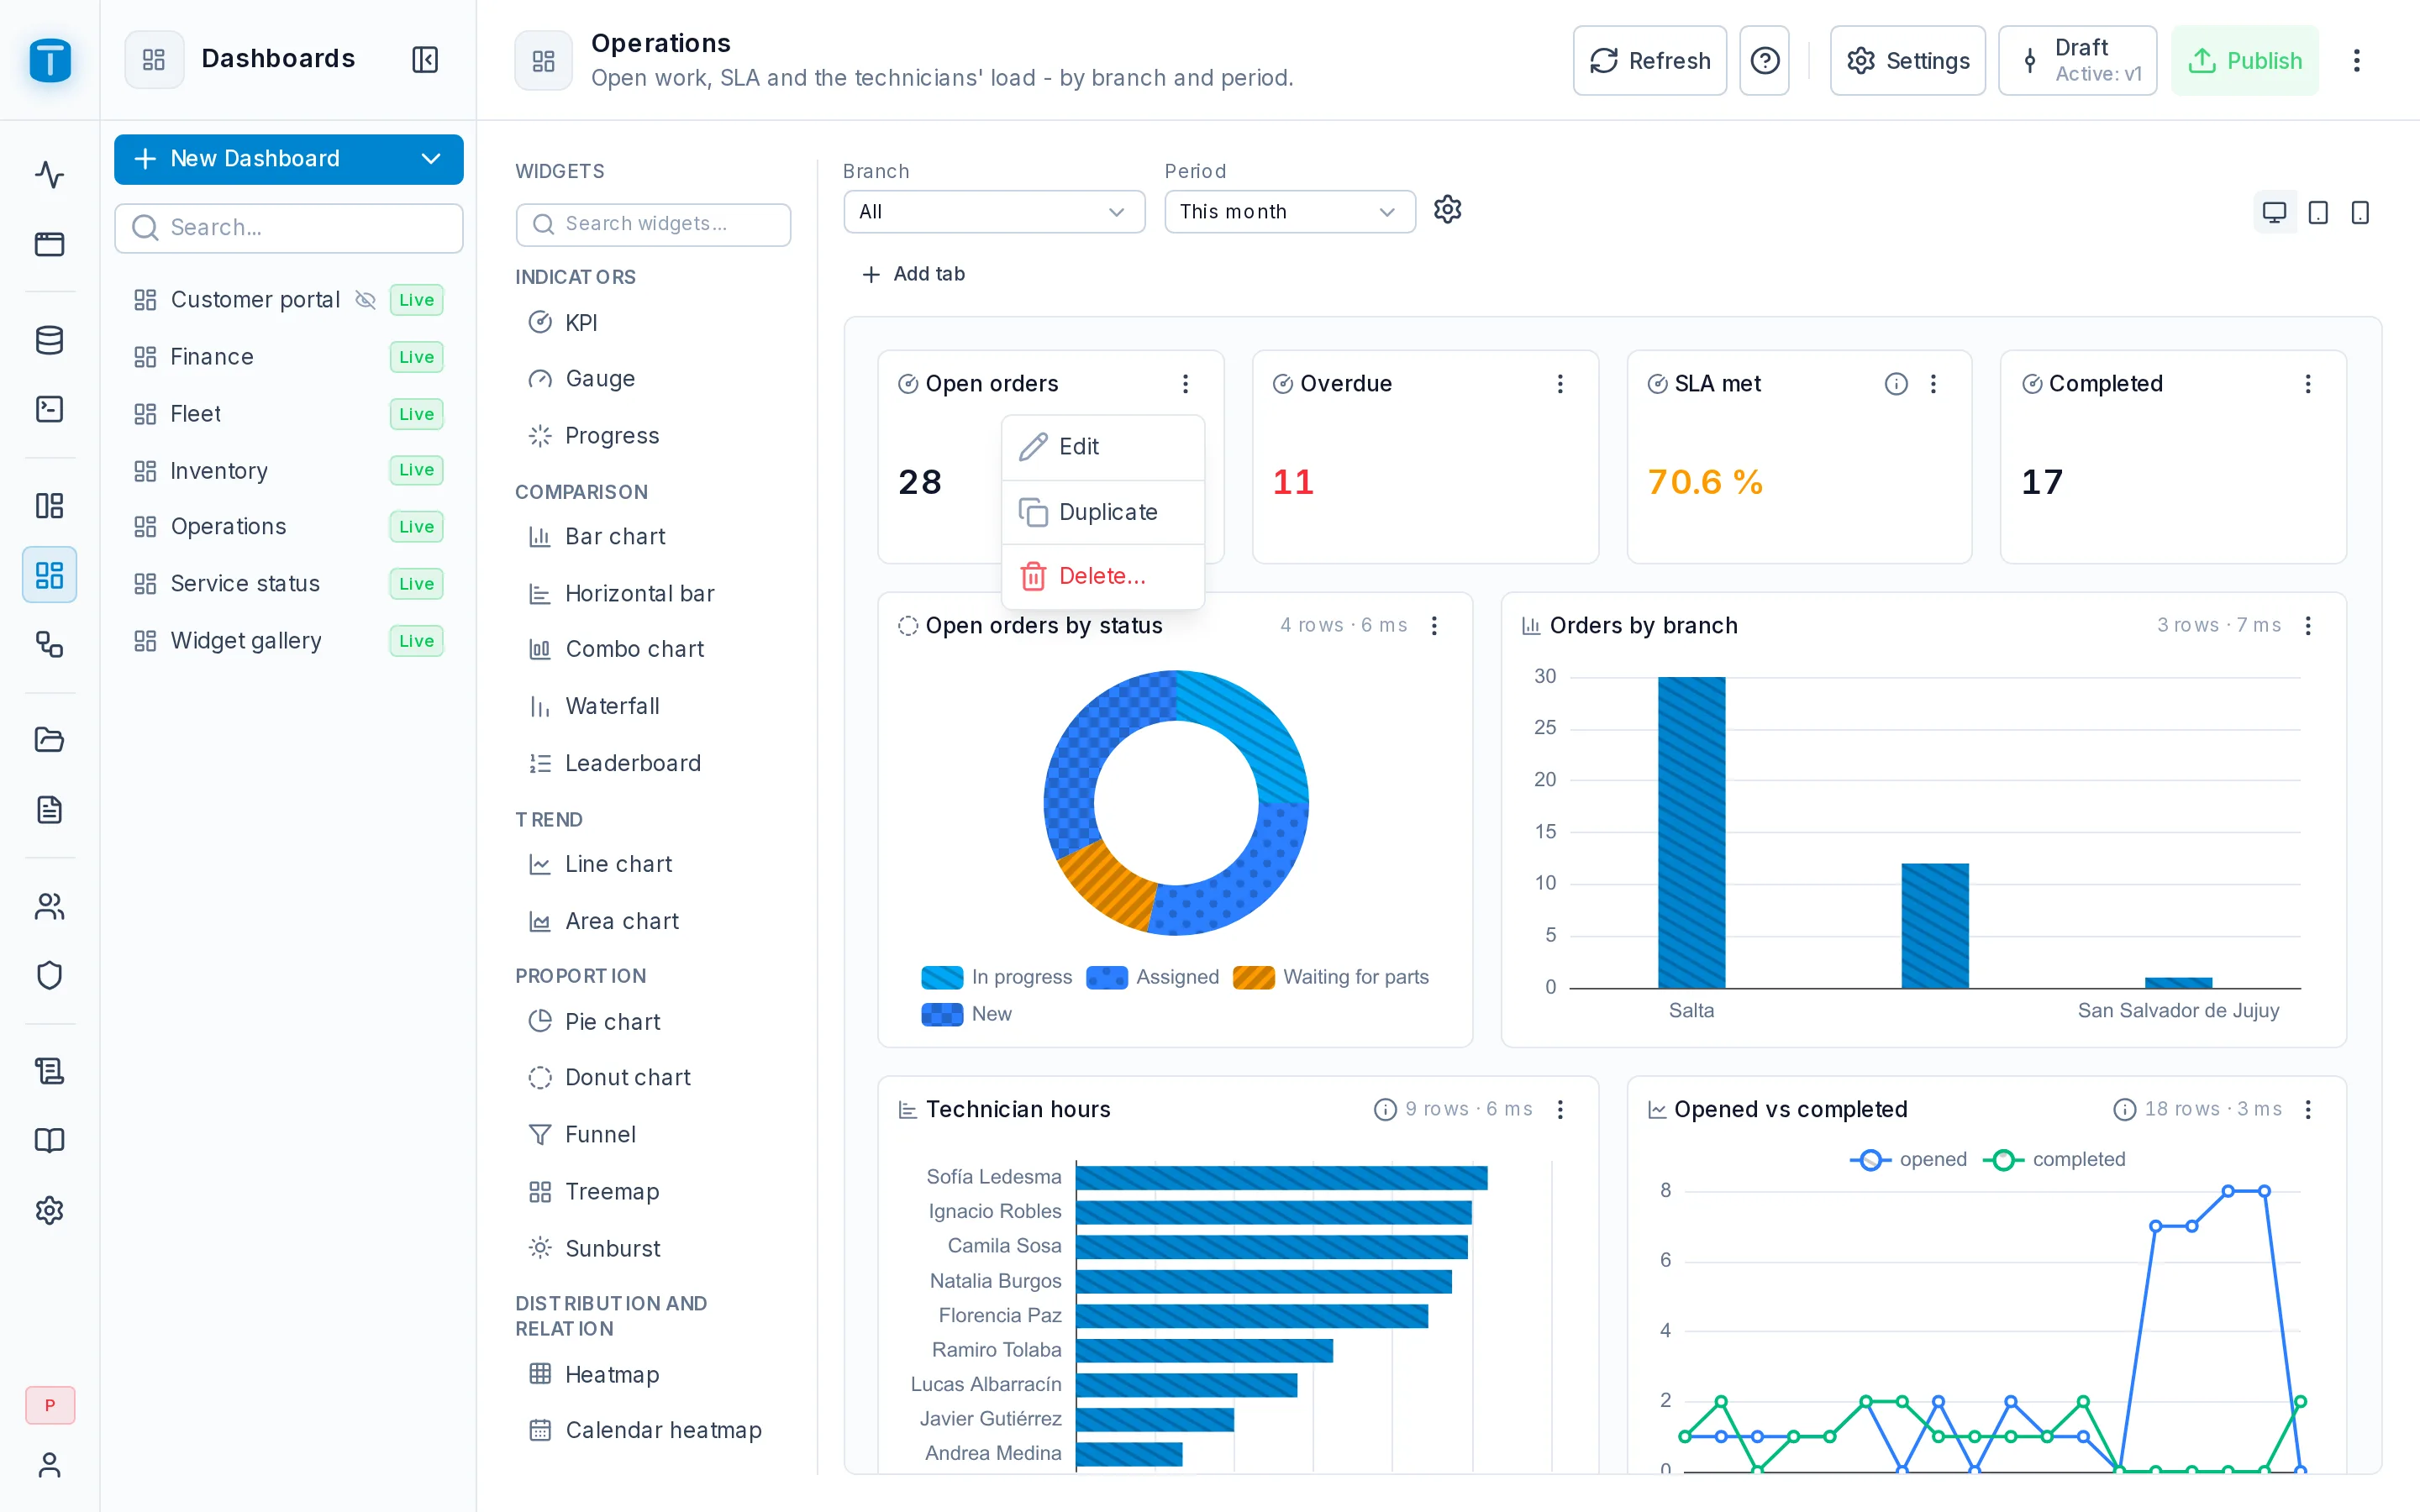
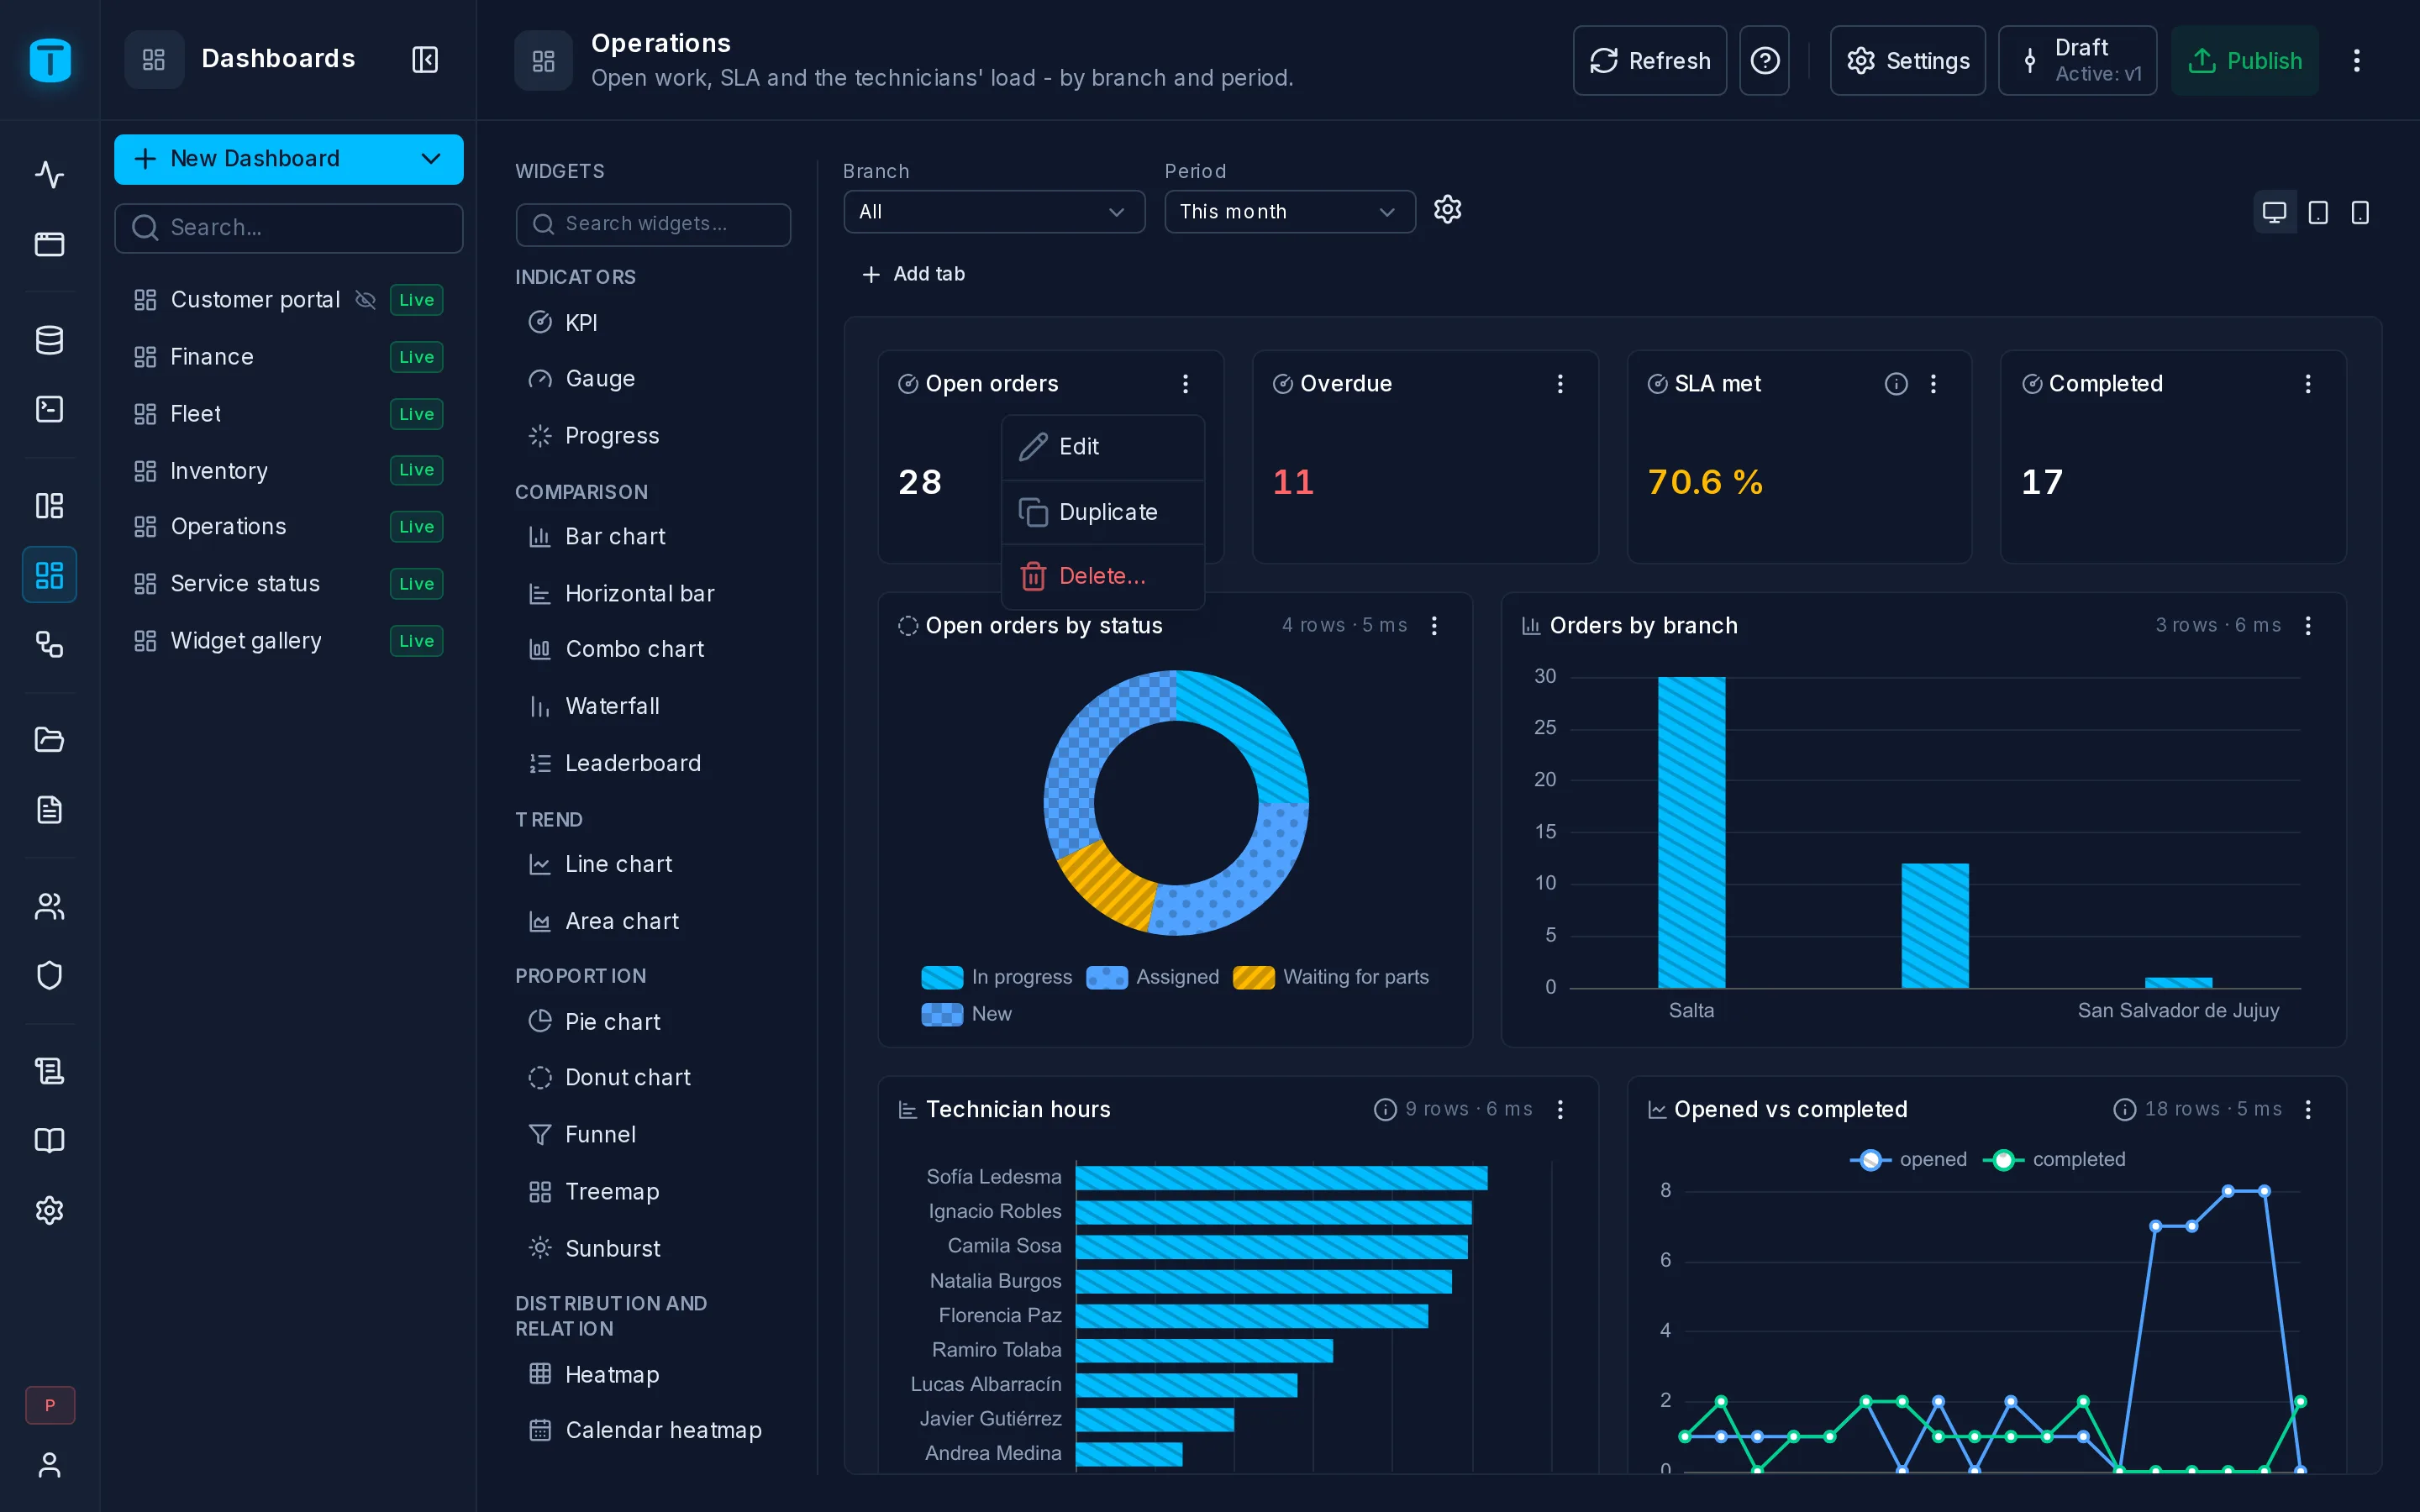
The variables bar
Above the canvas, a control per variable, the same viewers get. Changing a value re-runs only the widgets whose query uses it, and the value is kept in the page's address. The ⚙ beside the bar, Edit variables, opens Settings › Variables.
Desktop, tablet and phone
The three device buttons above the canvas show the dashboard as each device lays it out:
| Device | Width | Columns | |
|---|---|---|---|
| Desktop | the canvas | 12 | the layout you design and the only one saved |
| Tablet | 768 px | 6 | a small widget (a quarter of the desktop wide or less, such as a KPI) takes half a row; the rest the whole row |
| Phone | 390 px | 2 | small widgets two to a row, the rest the whole width |
Tablet and Phone are previews: widgets move and resize only on Desktop. A widget's On a phone setting can make it take the whole width, half, or hide it on a phone. See Editing a Widget.
On a phone or a tablet, the layout can't be dragged, but widgets can still be added (Add widget in the header opens the palette), edited and deleted.
Tabs
Add tab splits the dashboard into tabs, each with its own grid. The first tab takes every widget already on the canvas. The variables are the dashboard's, common to every tab.
A tab's ⋮ offers Rename… and Remove…. A tab that holds widgets moves them to the tab you choose before it goes. Removing the last tab puts its widgets back in one grid. A widget moves between tabs from its card's ⋮.
In the App, only the open tab's widgets run, each once it scrolls into view.
Publish
Publish asks Publish as v4? and takes an optional note. The confirmation also warns:
- how many widgets aren't configured: they're published, but the App never draws them;
- which embeds the publish would stop: an embed that locks a variable the draft no longer has. See Share.
Publishing checks every widget on every tab first. Each query is planned by PostgreSQL without reading a row, and its columns are checked against the widget's settings. A widget whose query fails, or that names a column, variable, DataView or dashboard that isn't there, stops the publish with what to fix.
Versions
Opening a version from Versions shows its widgets and variables on the canvas, read-only, under a banner: Viewing v3, with Restore, Save as… and Back to draft. The palette, editing and Publish are hidden meanwhile. See Settings › Versions.
Next steps
- Editing a Widget: its query and properties.
- Settings › Security: who opens it once published.