

Indicators
In the admin: a Dashboard › a widget › Edit
Indicators show one value. All three read it from the last row the query returns, so a one-row query and a time series ordered oldest first both work: in a series, the last row is "now".
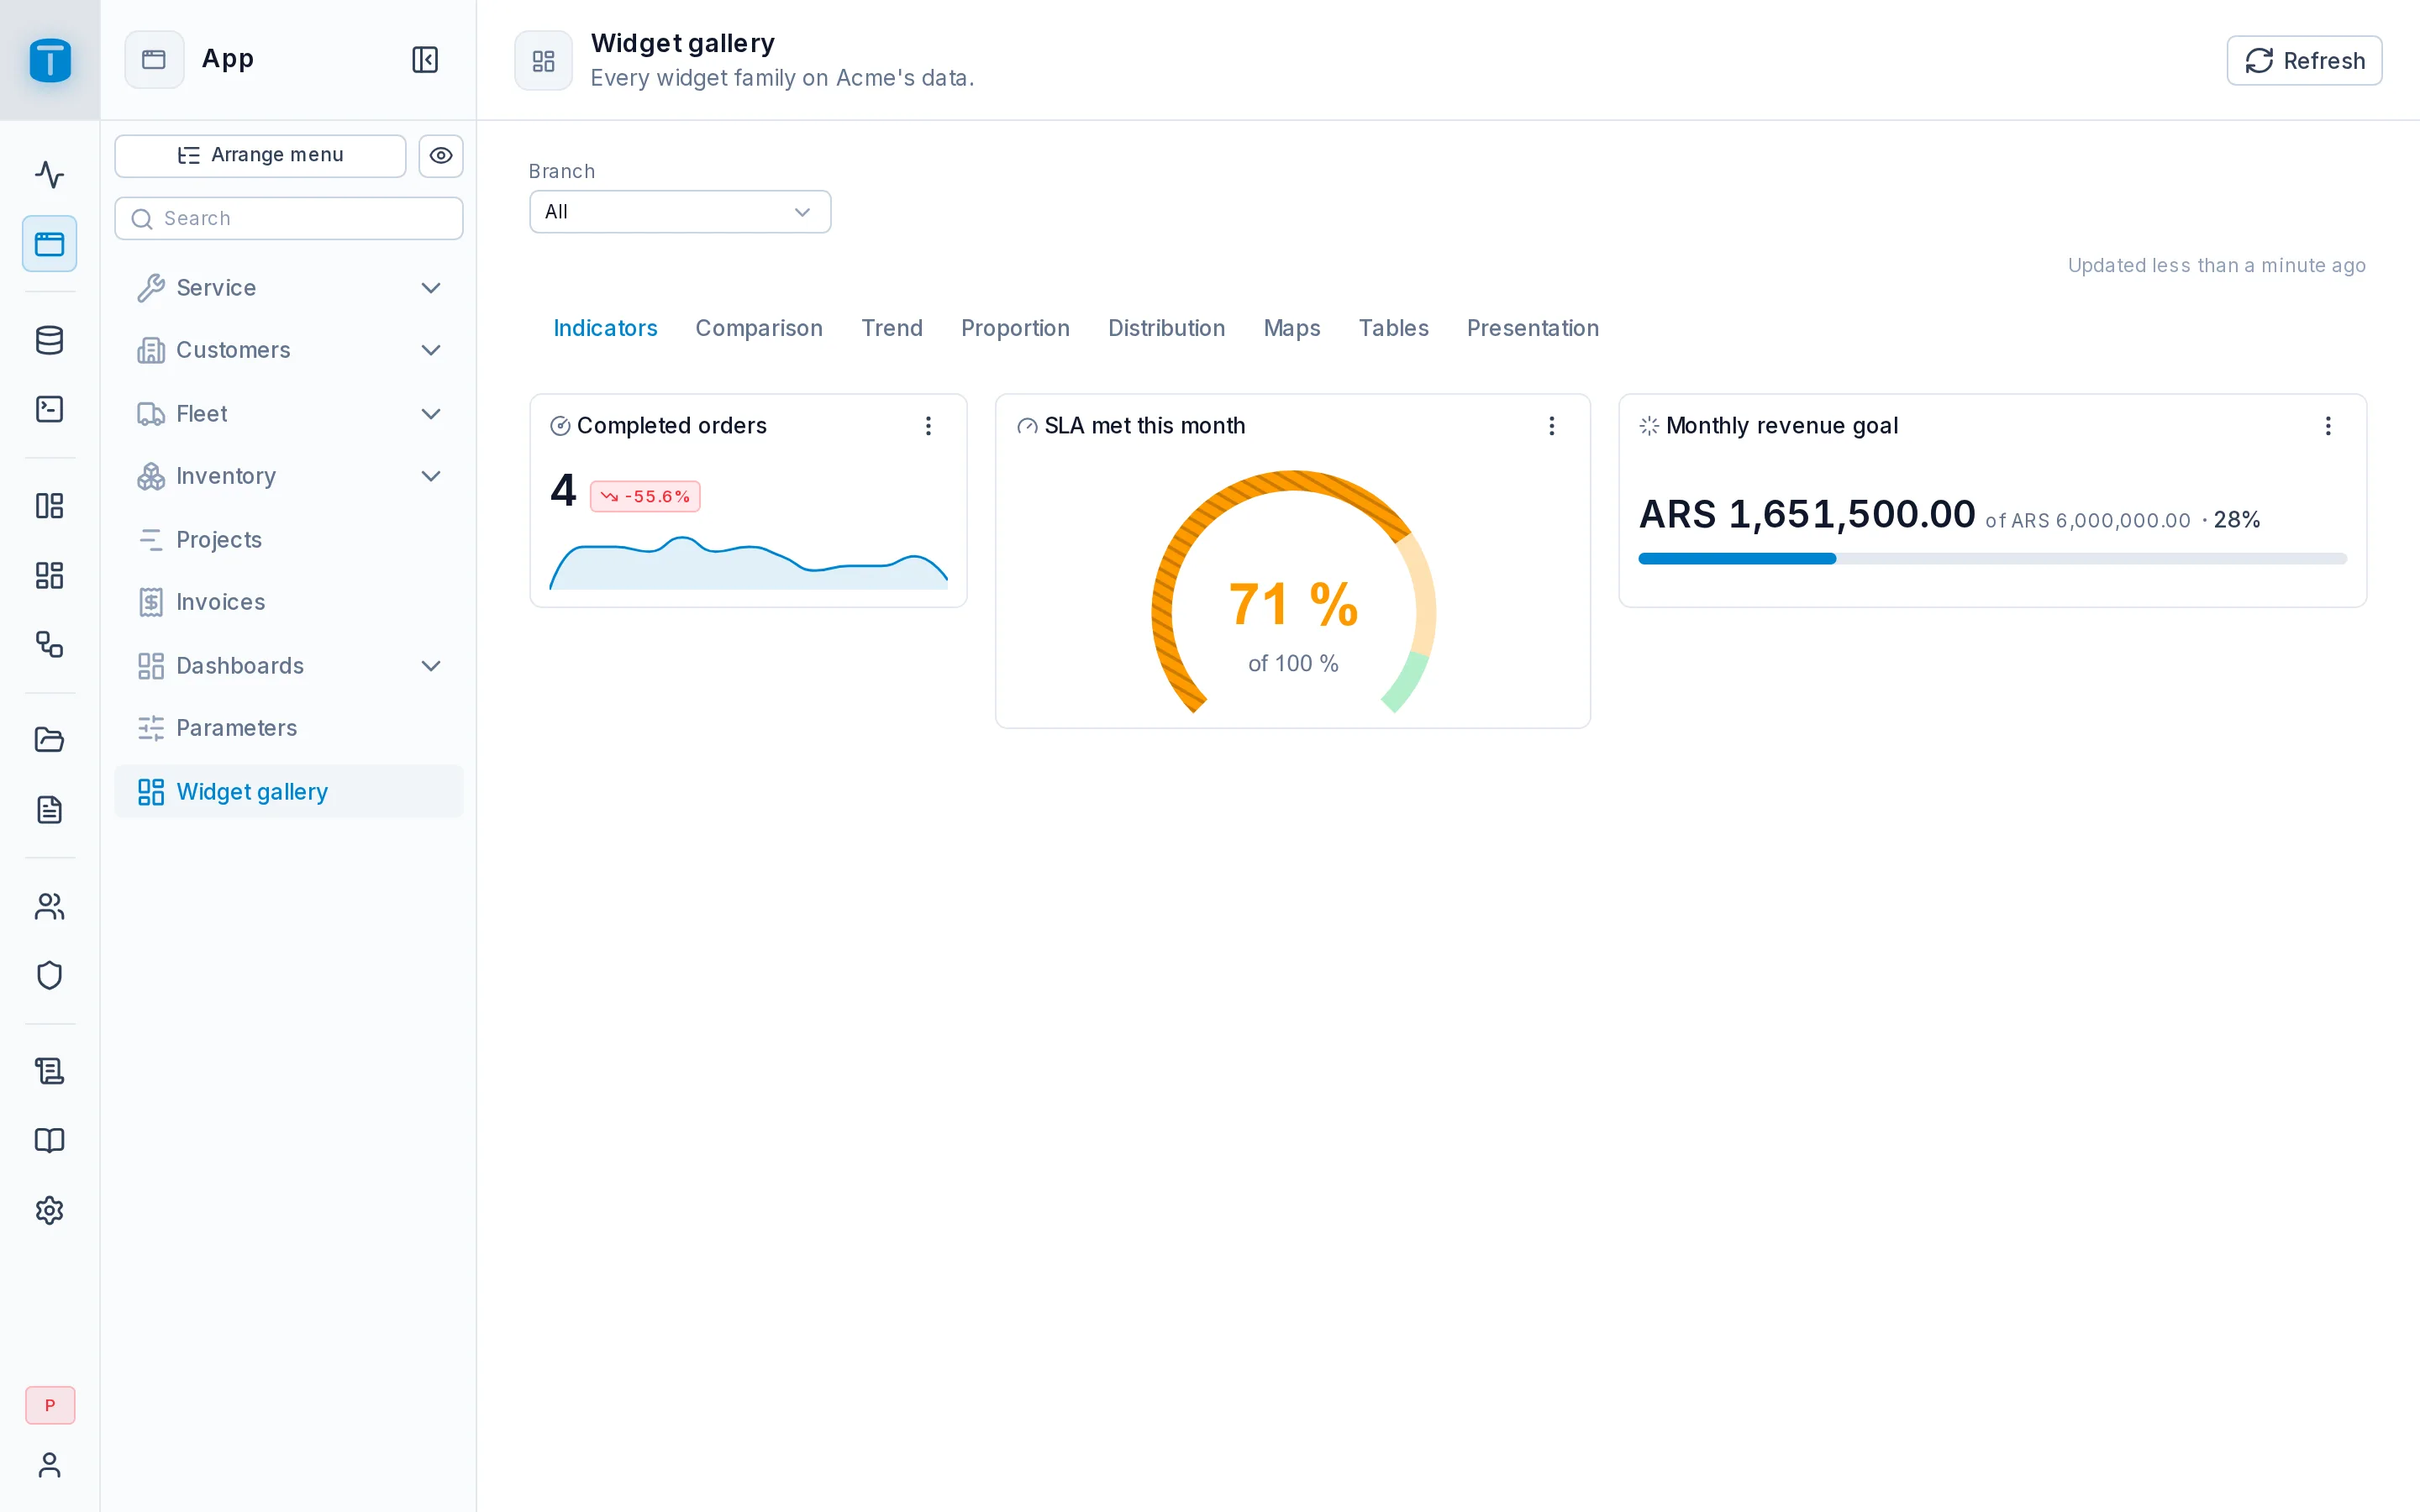
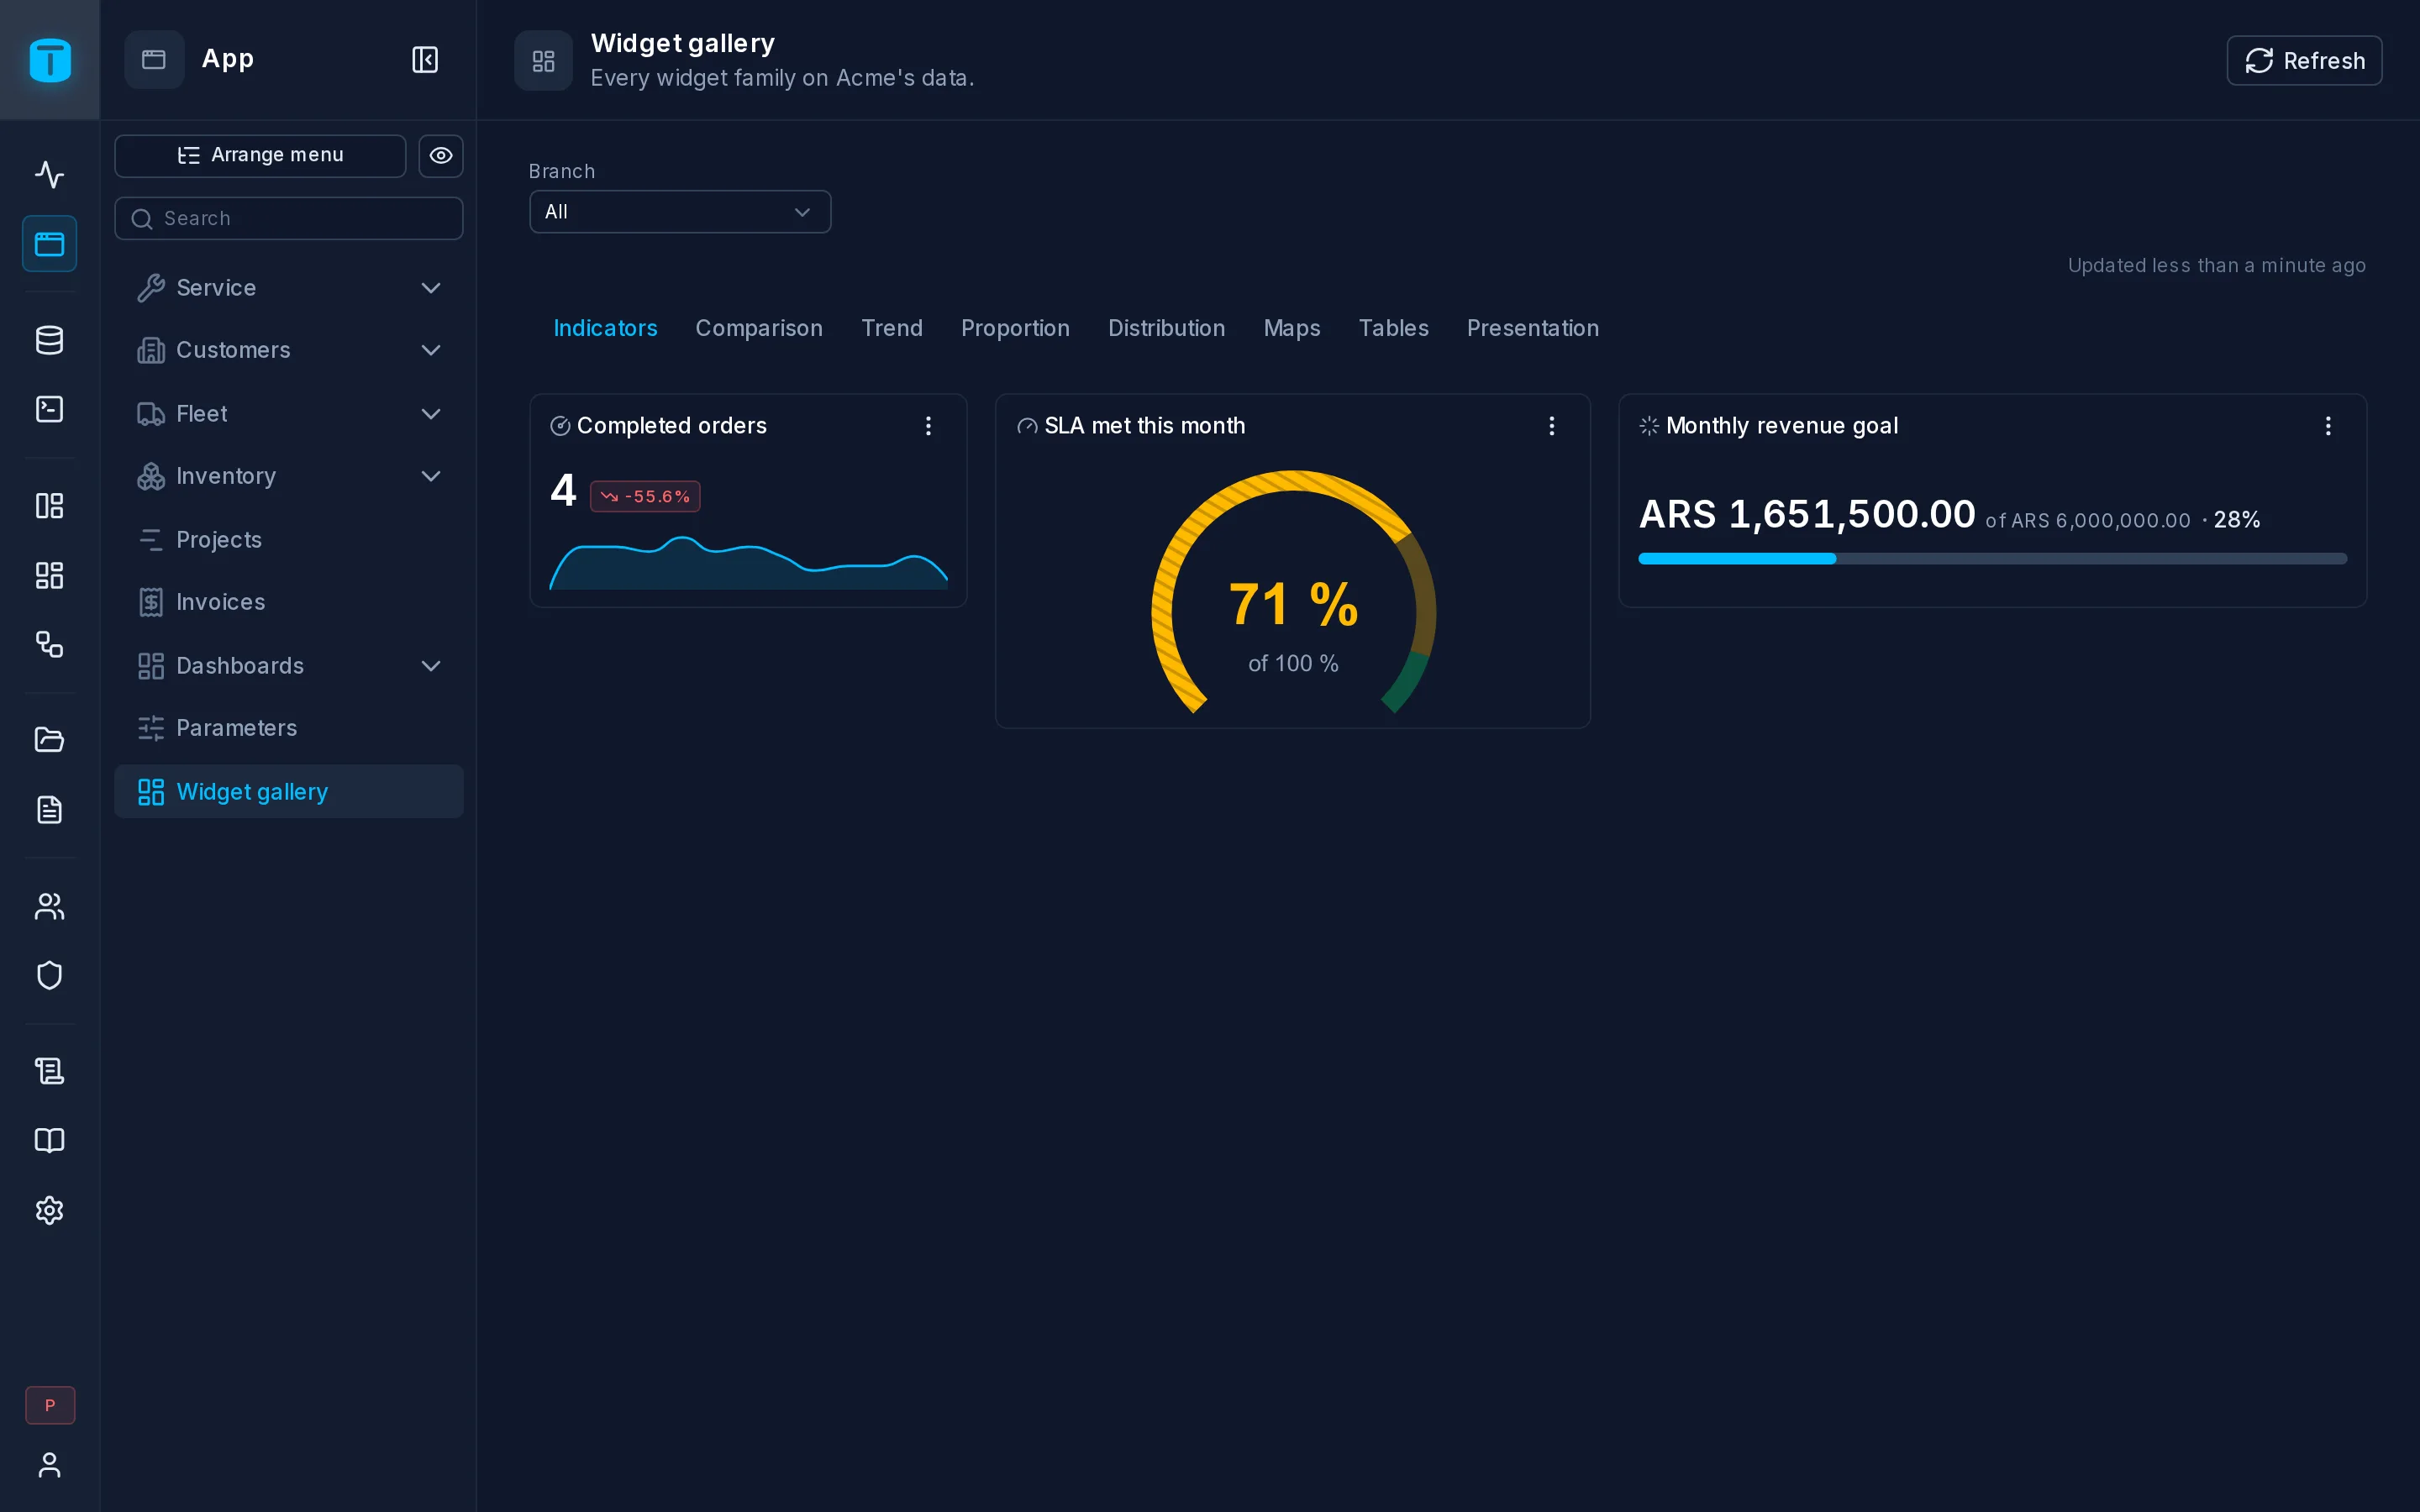
KPI
One number, large, with its change and its trend.
| Role | Takes | Unset |
|---|---|---|
| Value | a number | the first number column |
| Comparison | a number from the same row, such as last month's | the previous row's value |
| Time | a date or time: the rows are then a series, the last the value, the rest its trend | none |
| Target | a number, shown as of the target under the value | none |
Acme's open orders, filtered by the Branch variable:
SELECT count(*) AS open_orders
FROM work_orders
WHERE status NOT IN ('COMPLETED', 'CANCELLED')
  AND ($VAR.branch IS NULL OR branch = $VAR.branch::uuid)
Revenue this month, with its trend over the year: choose month for Time, then turn on Show change and Show trend.
SELECT date_trunc('month', i.issued_on)::date AS month,
       sum(ii.quantity * ii.unit_price) AS revenue
FROM invoices i
JOIN invoice_items ii ON ii.invoice = i.id
WHERE i.status <> 'DRAFT'
  AND i.issued_on >= date_trunc('month', current_date) - interval '11 months'
GROUP BY 1
ORDER BY 1
| Setting | |
|---|---|
| Format, Compact number | how the value reads: $ #,##0 with Compact reads $ 1.3M |
| Color | a palette hue for the number |
| Show change | the percent change against the Comparison, green up and red down. None without a previous value, or when it's 0 |
| Show trend | a small line of the value across the rows |
| Lower is better | flips the change's colors, for costs or response times |
| Thresholds | colors by value (below) |
| On click | what a click on the card does |
KPI
One number, large - with its change and its trend.
Size: 3 × 2 of the 12-column grid, at least 2 × 2 · Also: thresholds, events, export
| Data | Code | Takes | Required | Unset | |
|---|---|---|---|---|---|
| Value | value | number | yes | first | The number shown - from the last row. Defaults to the first number column. |
| Comparison | compare | number | none | The value it compares with, from the same row (e.g. last month's). Without it, the previous row's value. | |
| Time | time | time | none | With it, the rows are a series, oldest first: the last is the value, the rest its trend. | |
| Target | target | number | none | A goal from the query - shown as how far the value is from it. |
| Property | Code | Section | Values | |
|---|---|---|---|---|
| Format | displayFormat | format | How its numbers read - a displayFormat pattern: "$ #,##0", "#,##0.00", "0.0 %" (% never multiplies: 85 reads 85.0 %), "0.0 h", "CURRENCY:ARS". Unset: the value column's own (its presentation), else the locale's. | |
| Compact number | compact | format | Abbreviates large numbers - 11.6M, 2.4K - keeping the format's text and decimals ("$ #,##0" + compact: $ 1.3M). Unset: on, unless a format applies (its own or its column's). | |
| Color | color | appearance | A palette hue for its marks - unset, the theme's primary. | |
| Thresholds | thresholds | thresholds | Colors by value, in order: {color: "red"}, {from: 60, color: "amber"}, {from: 80, color: "green"} - the first, without from, the base. from: a number, {column} (the widget's row) or {variable} (a NUMBER or SELECT variable). Wins over Color. | |
| On click | click | events | What a click on a mark does: {action: "FILTER", variable, value} sets a variable of this dashboard; {action: "DATAVIEW", dataview, filter} opens a DataView filtered (the where grammar); {action: "DASHBOARD", dashboard, variables, tab}; {action: "RECORD", dataview, pk}; {action: "URL", url, newTab, inEmbeds}. Values are formulas over (_ columns too) and ; targets by id. hint: the tooltip's last line. | |
| Show change | showDelta | appearance | default false | Percent change vs. the comparison, green up / red down. |
| Show trend | sparkline | appearance | default false | A small line of the value across the rows (order them by time). |
| Lower is better | lowerIsBetter | appearance | default false | Flips the change's colors - for costs or response times. |
SELECT 1250 AS revenue, 1100 AS previous
Gauge
A value on an arc, from 0 to its target. The value is clamped to the arc.
| Role | Takes | Unset |
|---|---|---|
| Value | a number | the first number column |
| Target | the full arc, from the query | the Target setting, 100 |
The share of open orders still within their due time, with Format 0.0 %:
SELECT round(100.0 * count(*) FILTER (WHERE due_at >= now())
             / nullif(count(*), 0), 1) AS on_time
FROM work_orders
WHERE status NOT IN ('COMPLETED', 'CANCELLED')
With Thresholds red, amber from 80, green from 95, the arc is drawn in those bands.
GAUGE
A value on an arc, against its target.
Size: 4 × 3 of the 12-column grid, at least 2 × 2 · Also: thresholds, events, export
| Data | Code | Takes | Required | Unset | |
|---|---|---|---|---|---|
| Value | value | number | yes | first | The value on the arc - from the last row. Defaults to the first number column. |
| Target | target | number | none | The full arc, from the query. Without it, the Target prop. |
| Property | Code | Section | Values | |
|---|---|---|---|---|
| Target | target | format | default 100 | The value the full arc stands for, when the query has no Target column. |
| Format | displayFormat | format | How its numbers read - a displayFormat pattern: "$ #,##0", "#,##0.00", "0.0 %" (% never multiplies: 85 reads 85.0 %), "0.0 h", "CURRENCY:ARS". Unset: the value column's own (its presentation), else the locale's. | |
| Compact number | compact | format | Abbreviates large numbers - 11.6M, 2.4K - keeping the format's text and decimals ("$ #,##0" + compact: $ 1.3M). Unset: on, unless a format applies (its own or its column's). | |
| Color | color | appearance | A palette hue for its marks - unset, the theme's primary. | |
| Thresholds | thresholds | thresholds | Colors by value, in order: {color: "red"}, {from: 60, color: "amber"}, {from: 80, color: "green"} - the first, without from, the base. from: a number, {column} (the widget's row) or {variable} (a NUMBER or SELECT variable). Wins over Color. On a gauge, the arc in bands of those colors. | |
| On click | click | events | What a click on a mark does: {action: "FILTER", variable, value} sets a variable of this dashboard; {action: "DATAVIEW", dataview, filter} opens a DataView filtered (the where grammar); {action: "DASHBOARD", dashboard, variables, tab}; {action: "RECORD", dataview, pk}; {action: "URL", url, newTab, inEmbeds}. Values are formulas over (_ columns too) and ; targets by id. hint: the tooltip's last line. |
SELECT 72 AS satisfaction
Progress
A bar of a value toward its target: $ 13.9M of $ 30M · 46 %.
| Role | Takes | Unset |
|---|---|---|
| Value | a number | the first number column |
| Target | a number | the Target setting, 100 |
Billed this month against the month's goal; choose goal for Target:
SELECT sum(ii.quantity * ii.unit_price) AS billed, 30000000 AS goal
FROM invoices i
JOIN invoice_items ii ON ii.invoice = i.id
WHERE i.status <> 'DRAFT'
  AND i.issued_on >= date_trunc('month', current_date)
| Setting | |
|---|---|
| Show target | of $ 30M after the value. On by default |
| Show percent | the share reached; past the target, its real value (115 %). On by default |
| Thresholds, Thresholds on | colors by value; Thresholds on: Percent reads them against the percent instead (60 = 60 %) |
Past the target, the bar is full. In a card one row high, the value and the bar sit side by side.
PROGRESS
A bar of a value toward its target - "$ 13.9M of $ 30M · 46 %", colored by thresholds.
Size: 4 × 2 of the 12-column grid, at least 3 × 1 · Also: thresholds, events, export
| Data | Code | Takes | Required | Unset | |
|---|---|---|---|---|---|
| Value | value | number | yes | first | The value - from the last row. Defaults to the first number column. |
| Target | target | number | none | The goal, from the query. Without it, the Target prop. |
| Property | Code | Section | Values | |
|---|---|---|---|---|
| Target | target | format | default 100 | The goal, when the query has no Target column. |
| Format | displayFormat | format | How its numbers read - a displayFormat pattern: "$ #,##0", "#,##0.00", "0.0 %" (% never multiplies: 85 reads 85.0 %), "0.0 h", "CURRENCY:ARS". Unset: the value column's own (its presentation), else the locale's. | |
| Compact number | compact | format | Abbreviates large numbers - 11.6M, 2.4K - keeping the format's text and decimals ("$ #,##0" + compact: $ 1.3M). Unset: on, unless a format applies (its own or its column's). | |
| Color | color | appearance | A palette hue for its marks - unset, the theme's primary. | |
| Show target | showTarget | appearance | default true | "of $ 30M" after the value. |
| Show percent | showPercent | appearance | default true | The share of the target reached - past it, its real value (115 %). |
| Thresholds | thresholds | thresholds | Colors by value, in order: {color: "red"}, {from: 60, color: "amber"}, {from: 80, color: "green"} - the first, without from, the base. from: a number, {column} (the widget's row) or {variable} (a NUMBER or SELECT variable). Wins over Color. On the value, or on the percent with thresholdsOn: PERCENT. | |
| Thresholds on | thresholdsOn | thresholds | VALUE, PERCENT; default VALUE | VALUE: the thresholds' from is the value; PERCENT: the percent of the target (60 = 60 %). |
| On click | click | events | What a click on a mark does: {action: "FILTER", variable, value} sets a variable of this dashboard; {action: "DATAVIEW", dataview, filter} opens a DataView filtered (the where grammar); {action: "DASHBOARD", dashboard, variables, tab}; {action: "RECORD", dataview, pk}; {action: "URL", url, newTab, inEmbeds}. Values are formulas over (_ columns too) and ; targets by id. hint: the tooltip's last line. |
SELECT 13900000 AS billed, 30000000 AS goal
Thresholds
KPI, Gauge and Progress take Thresholds: a base color, then each next color from its value up. A KPI's number, a Gauge's arc and a Progress bar take the color their value falls in, over Color. Each threshold's From is one of:
- a Number:
80; - a Column of the row the widget shows, such as a target the query computes;
- a Variable of the dashboard, Number or Select, so viewers can move it.
Colors are palette names. A threshold that names a column the query doesn't return, or a variable that doesn't exist, is refused on save.
Next steps
- Comparison: bars, combos, waterfalls and rankings.
- Editing a Widget: roles and formats.